
I thought it would be a good "New Year" exercise to update the FEST map and add some thoughts on each climate tech sector.
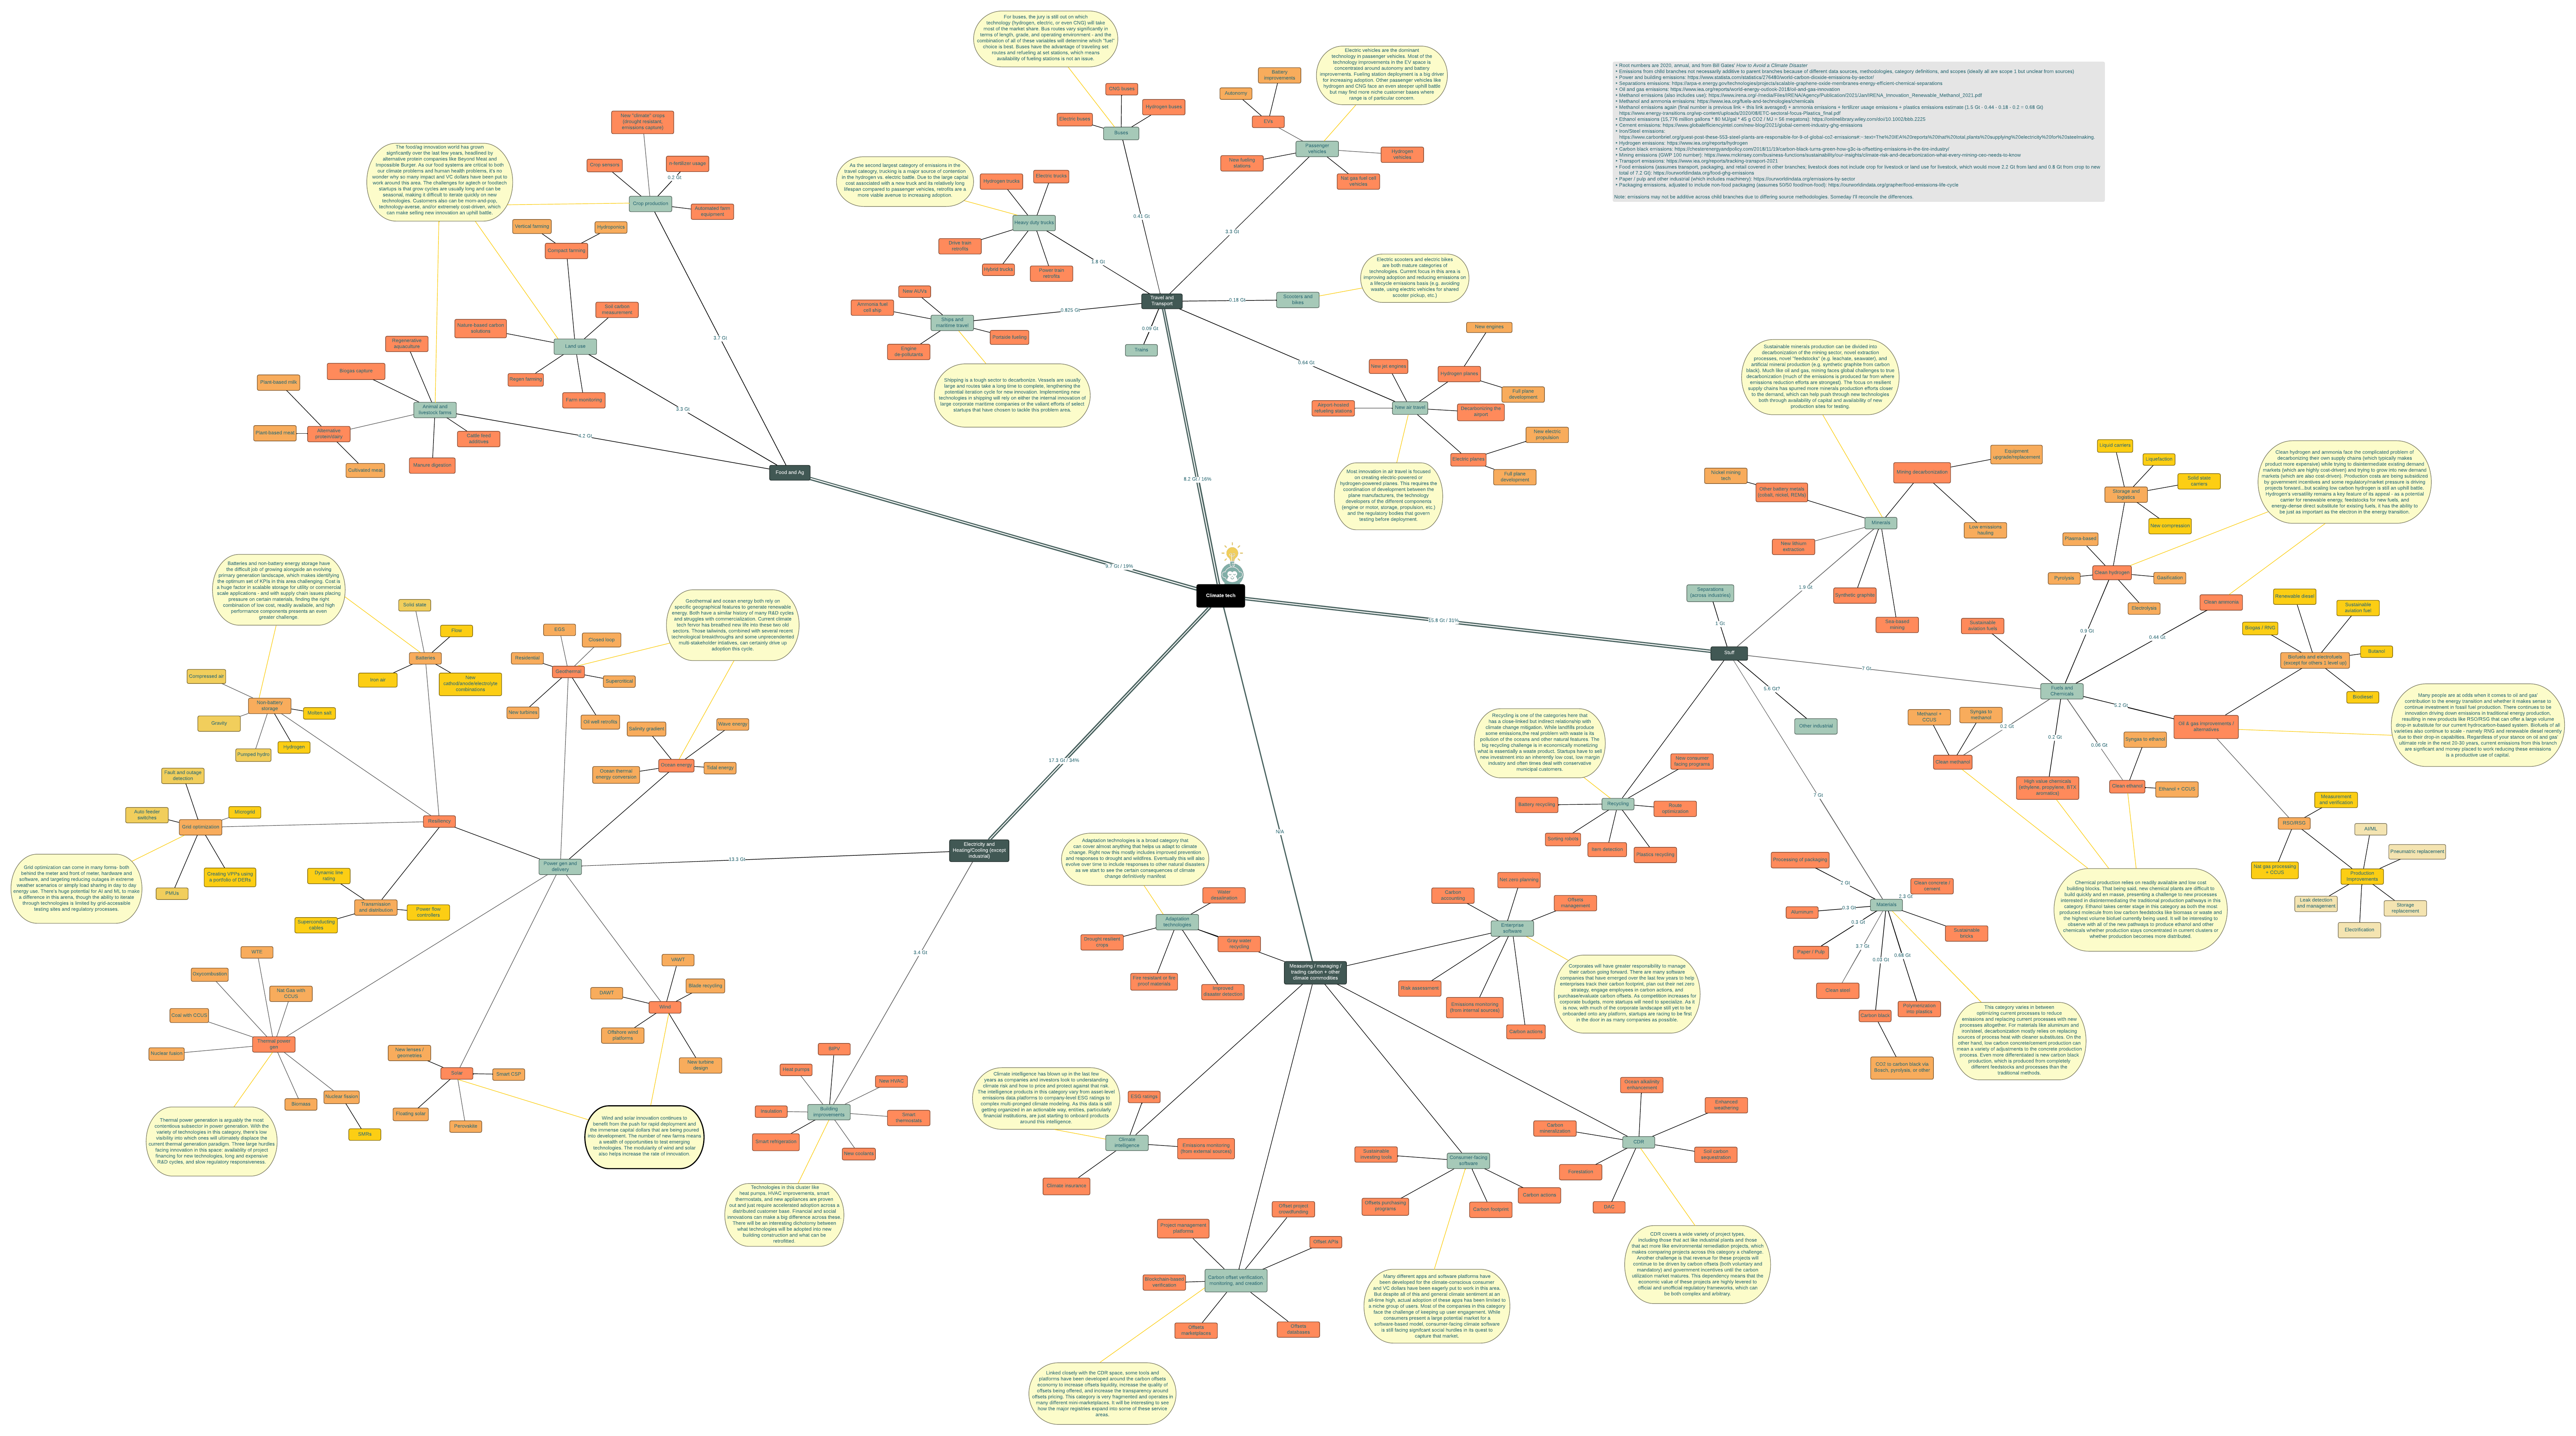
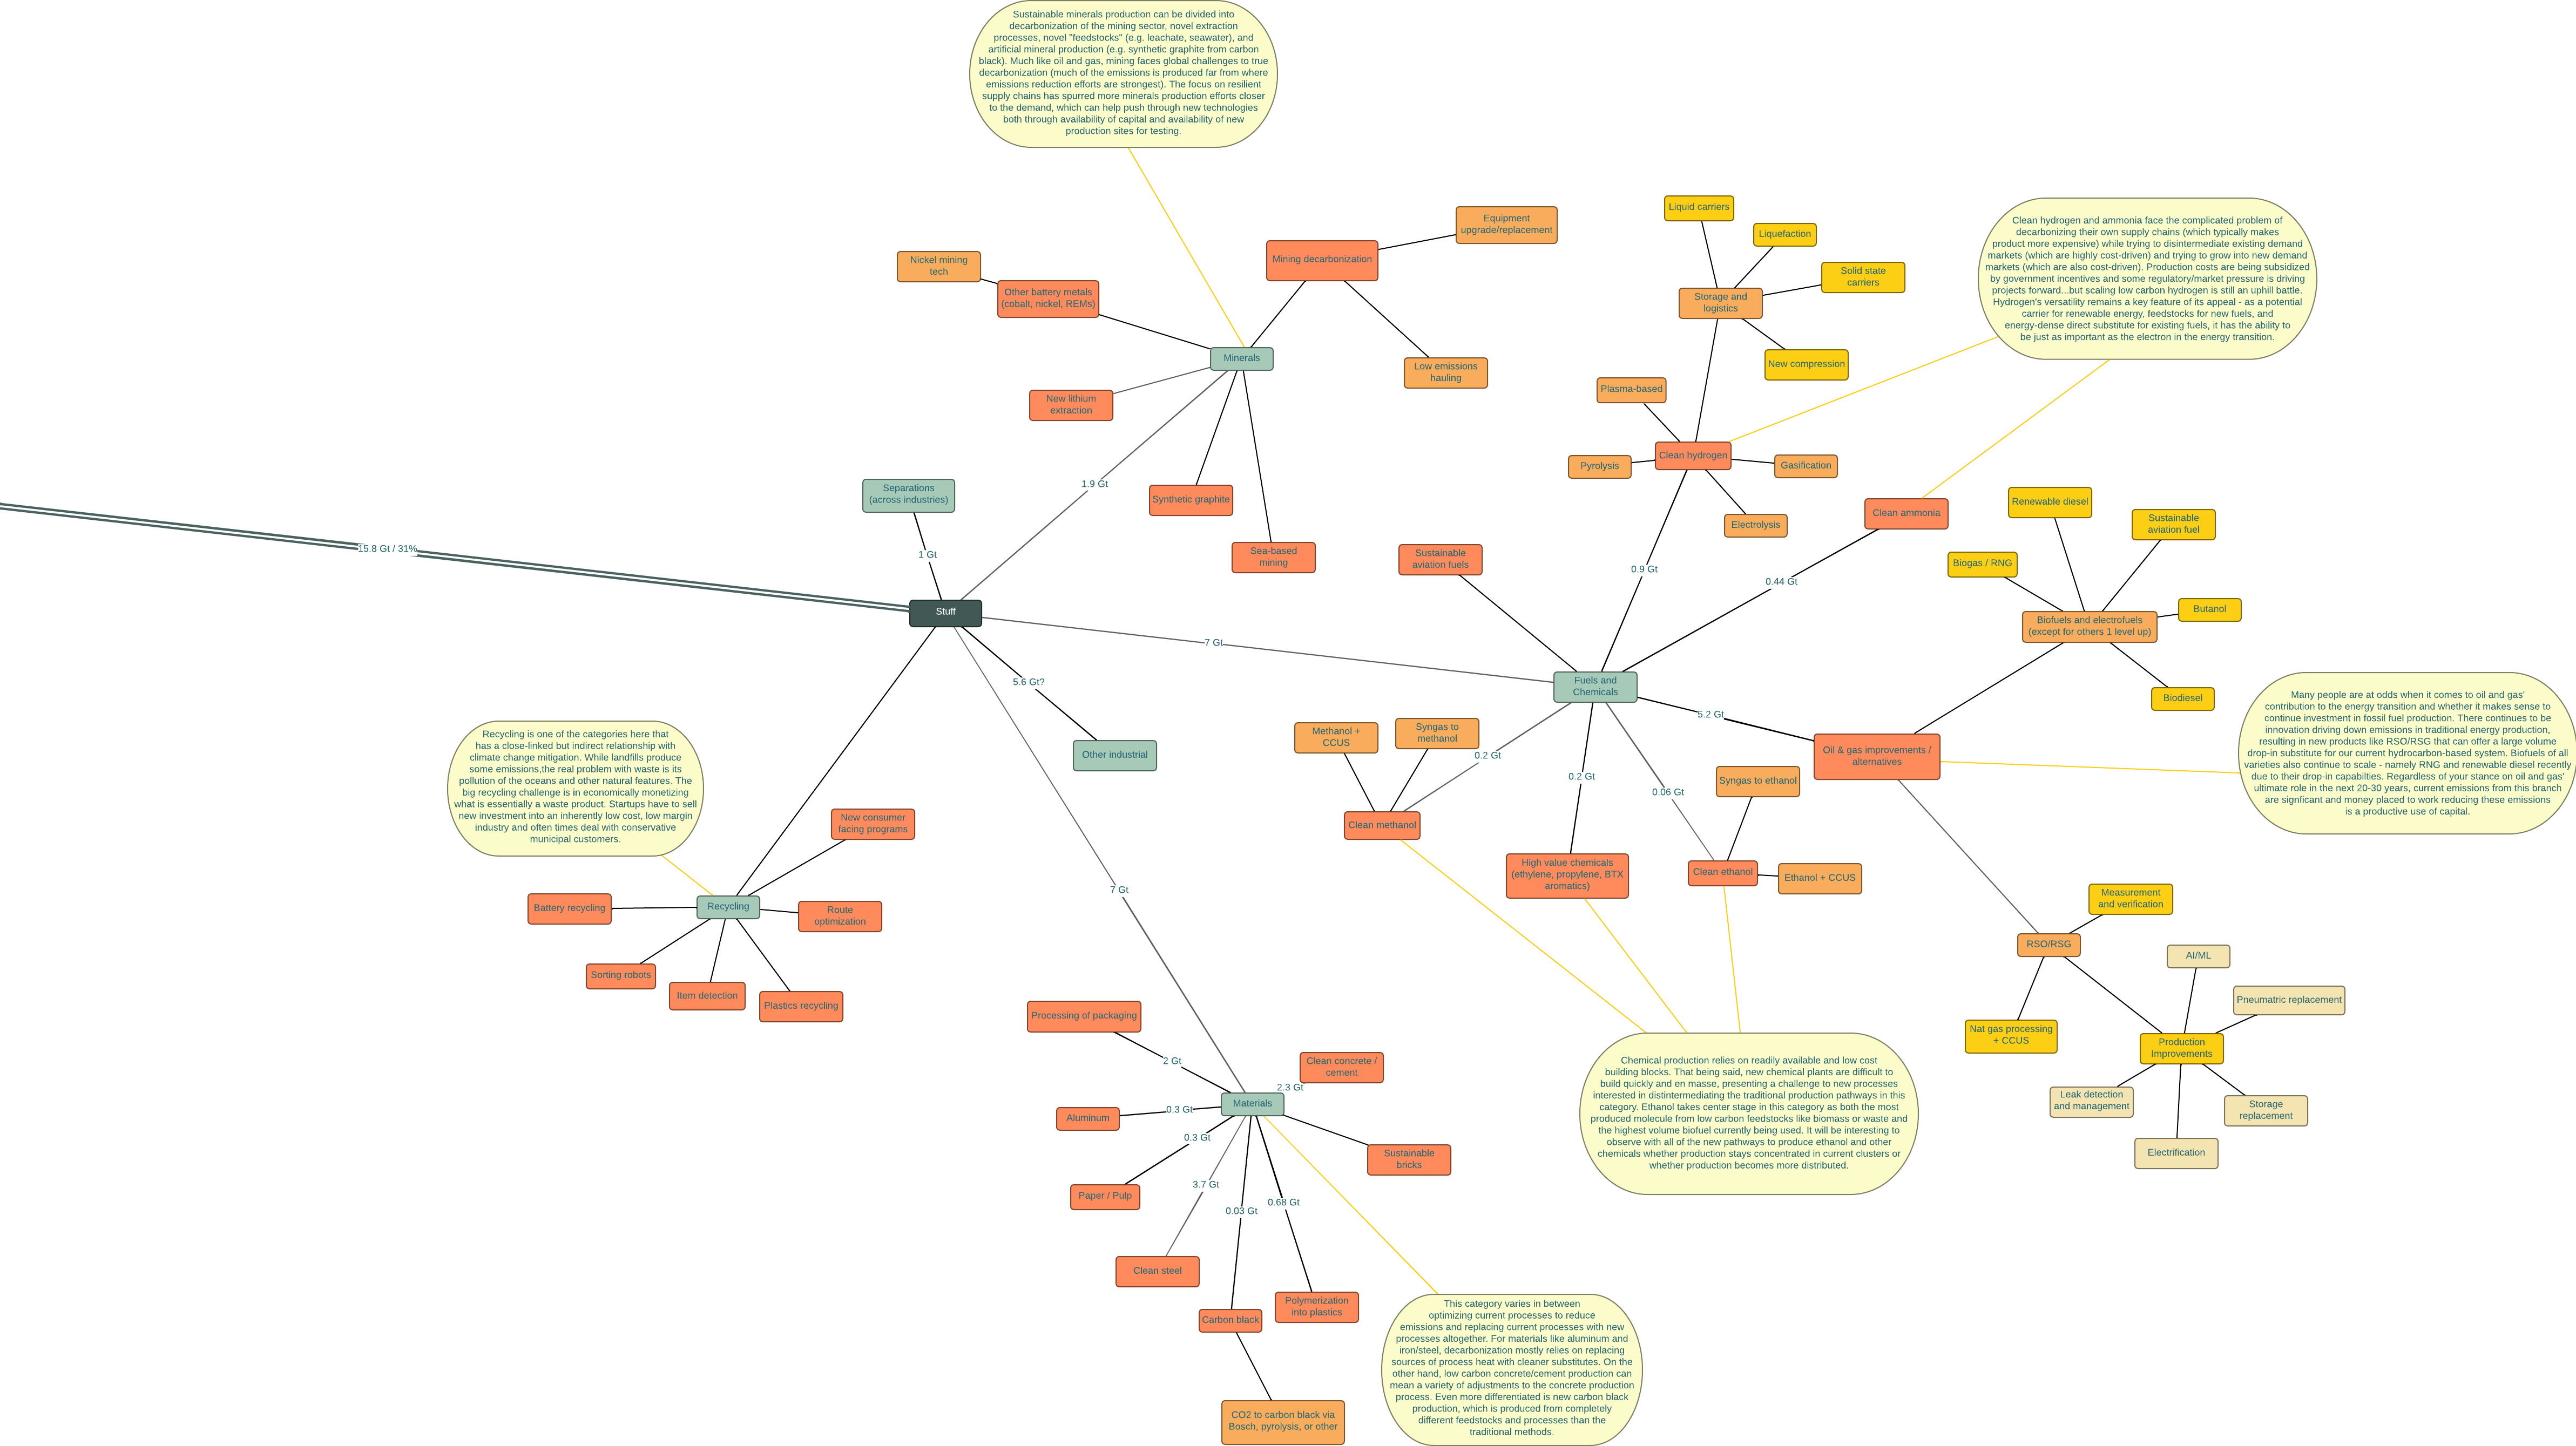
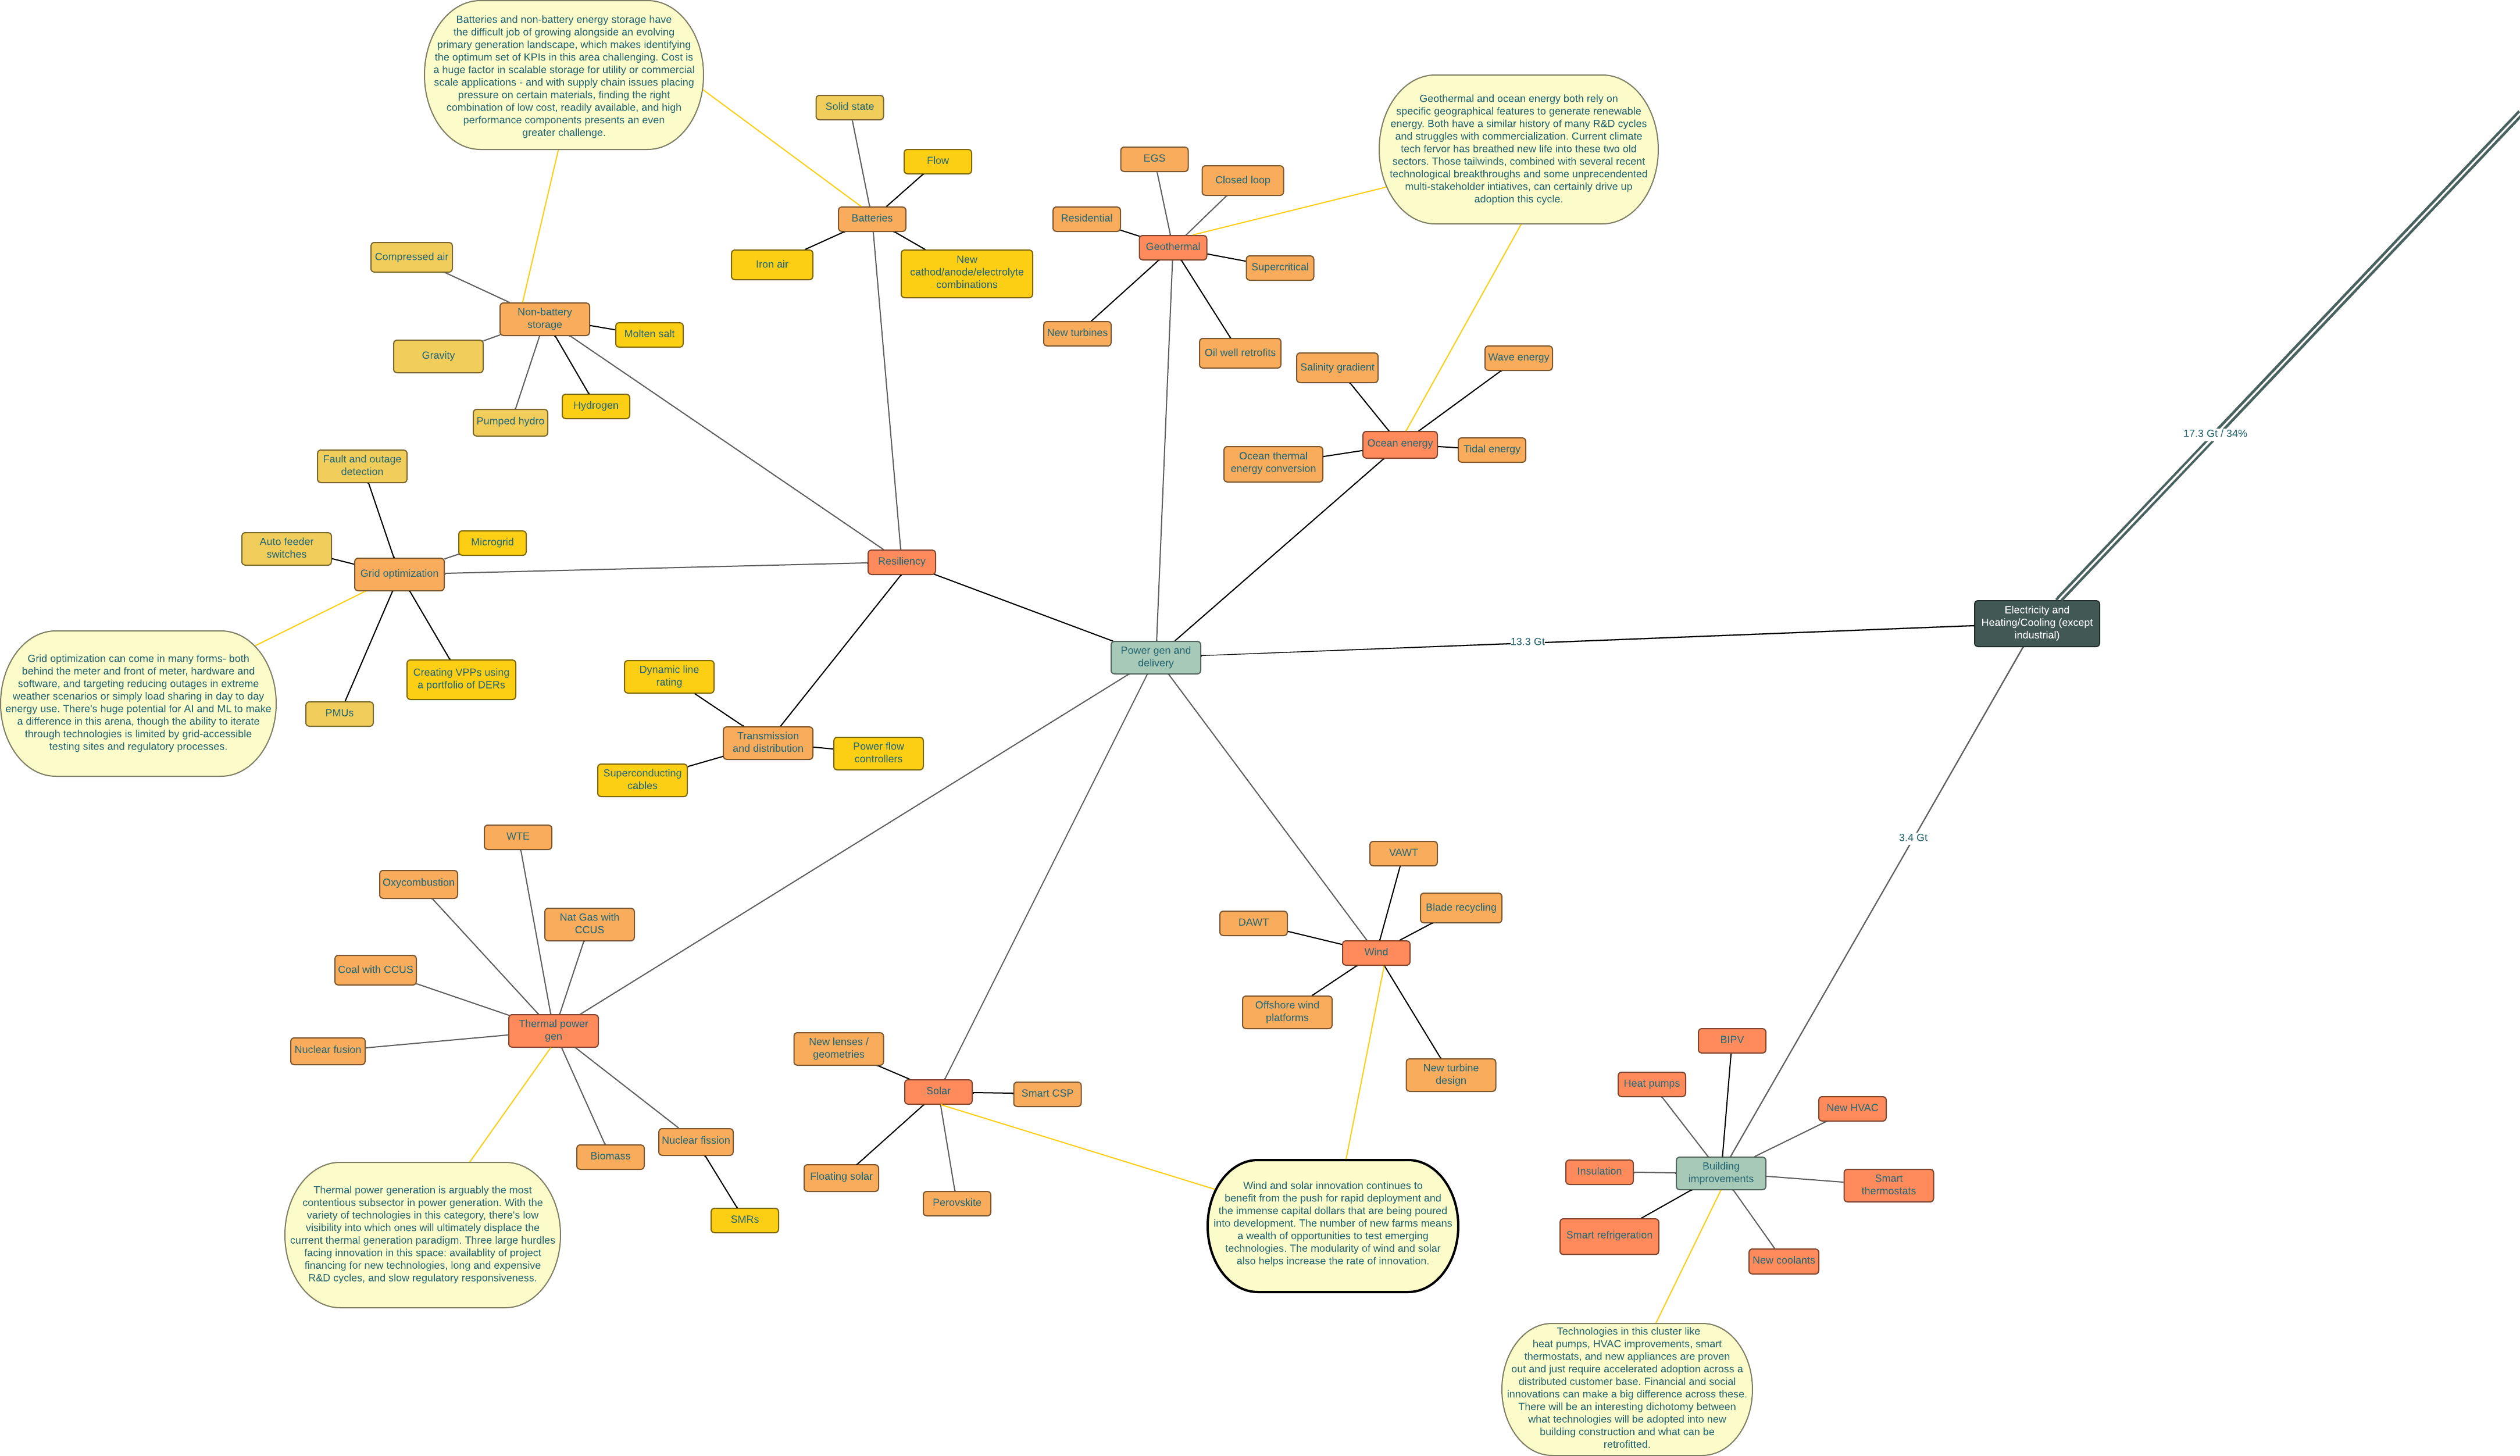
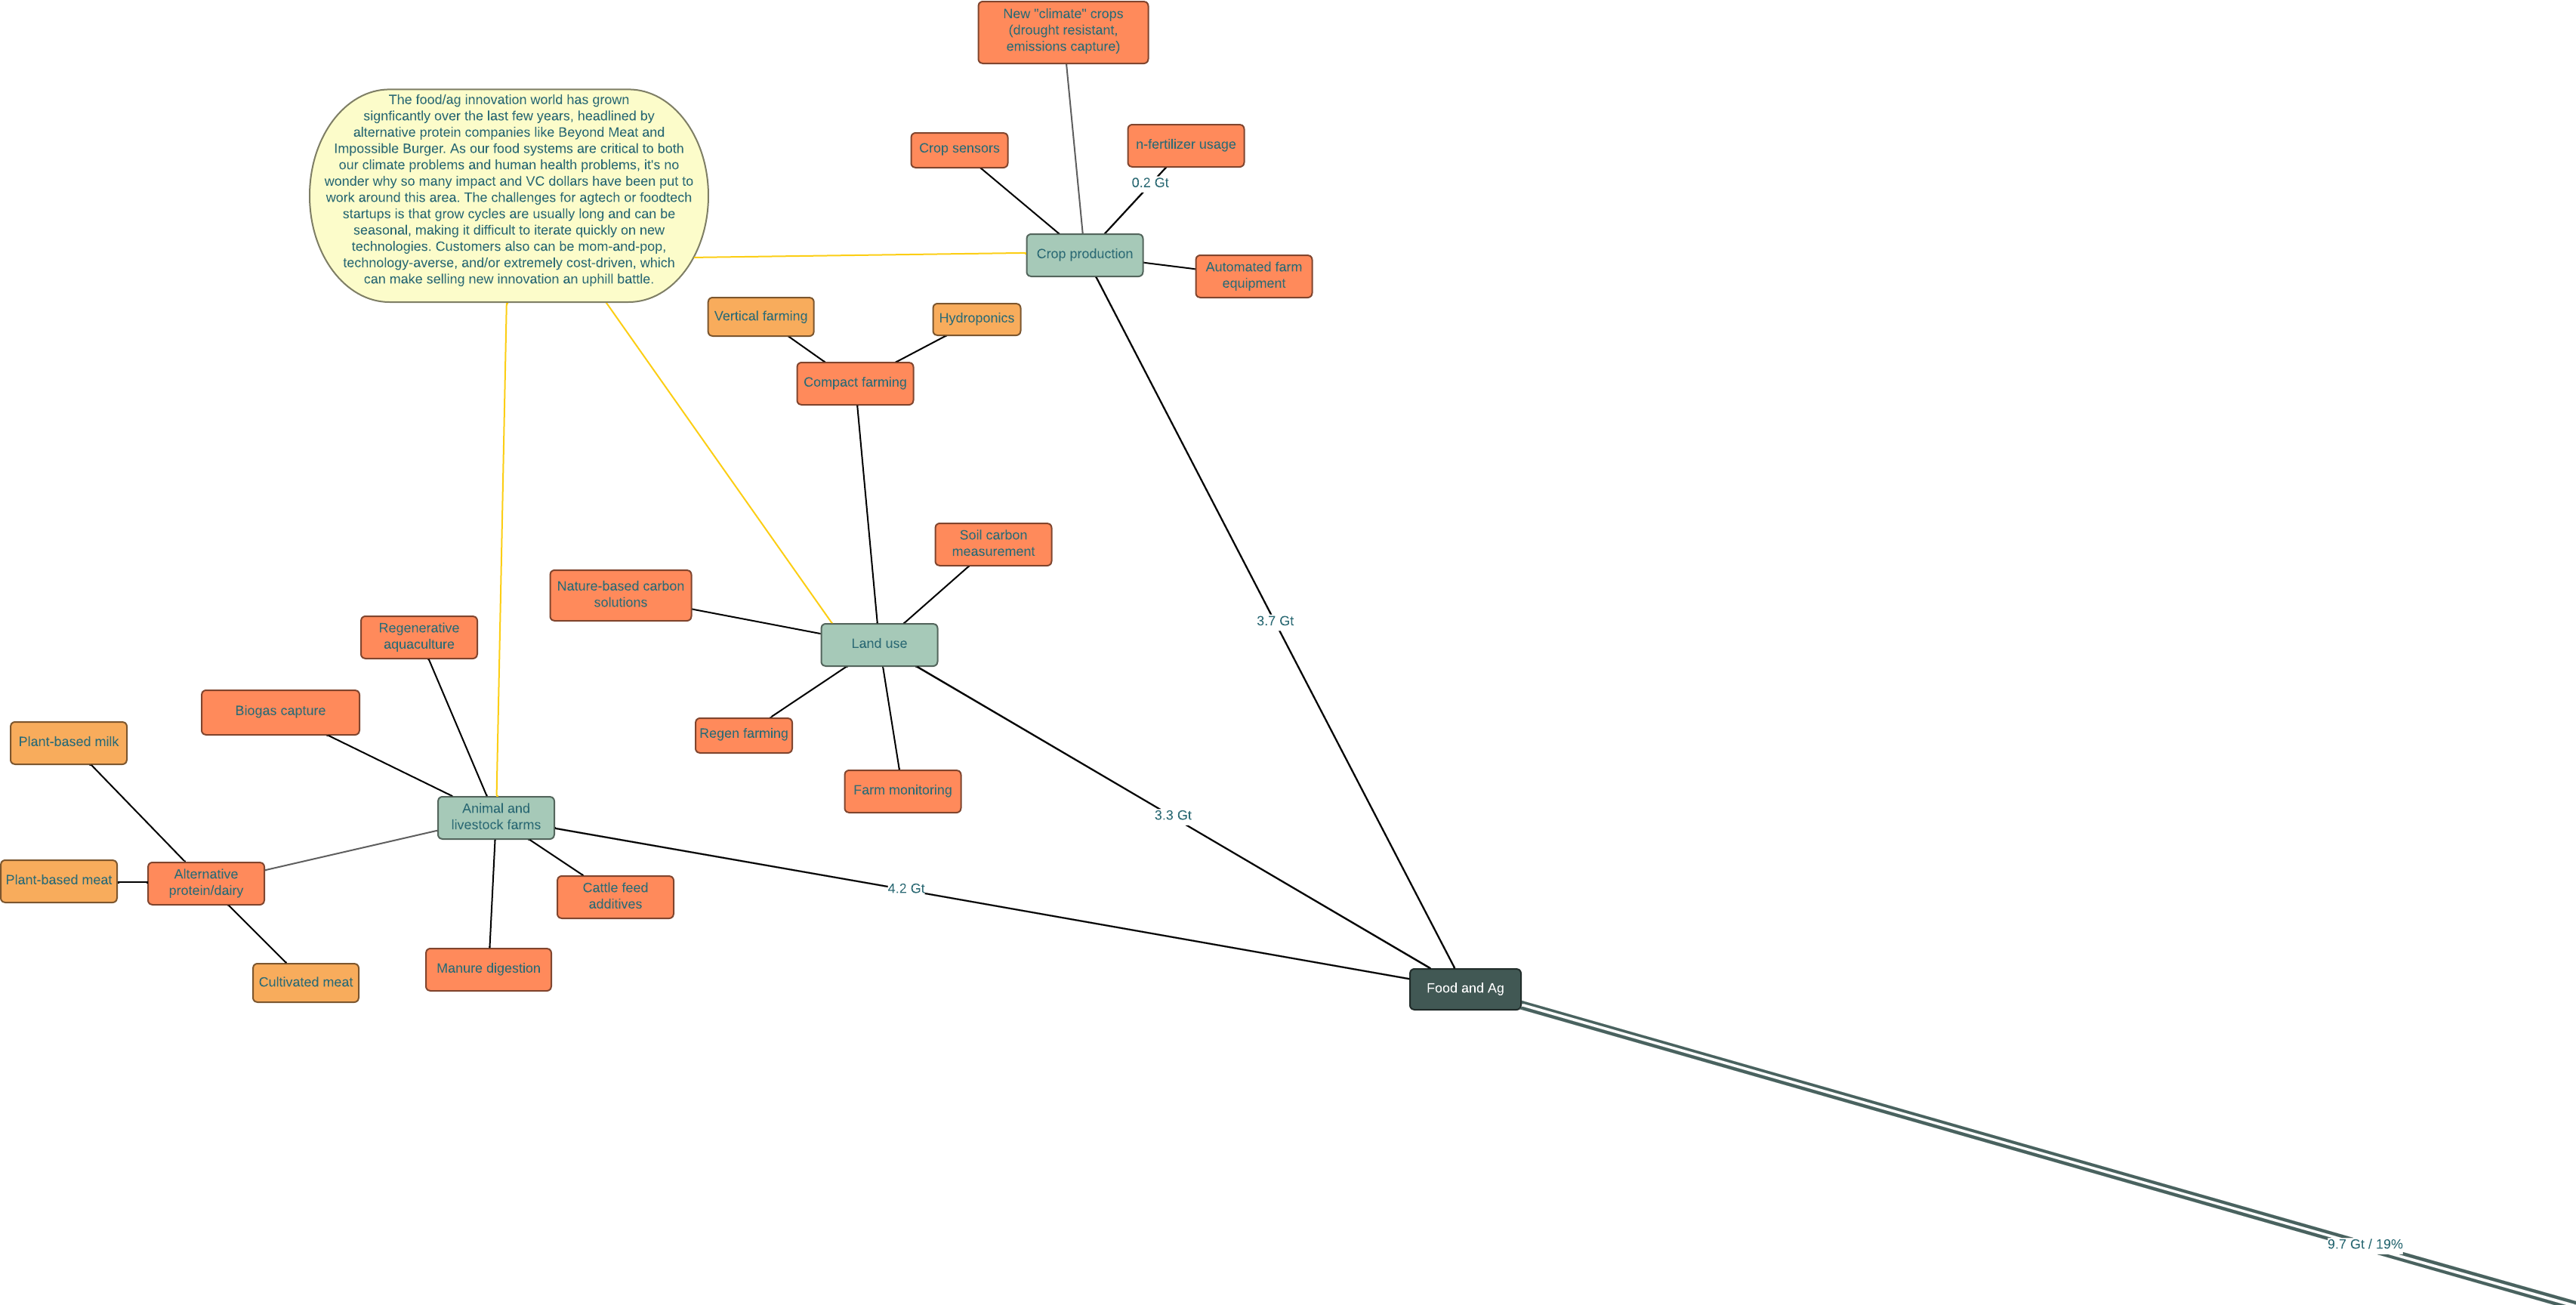
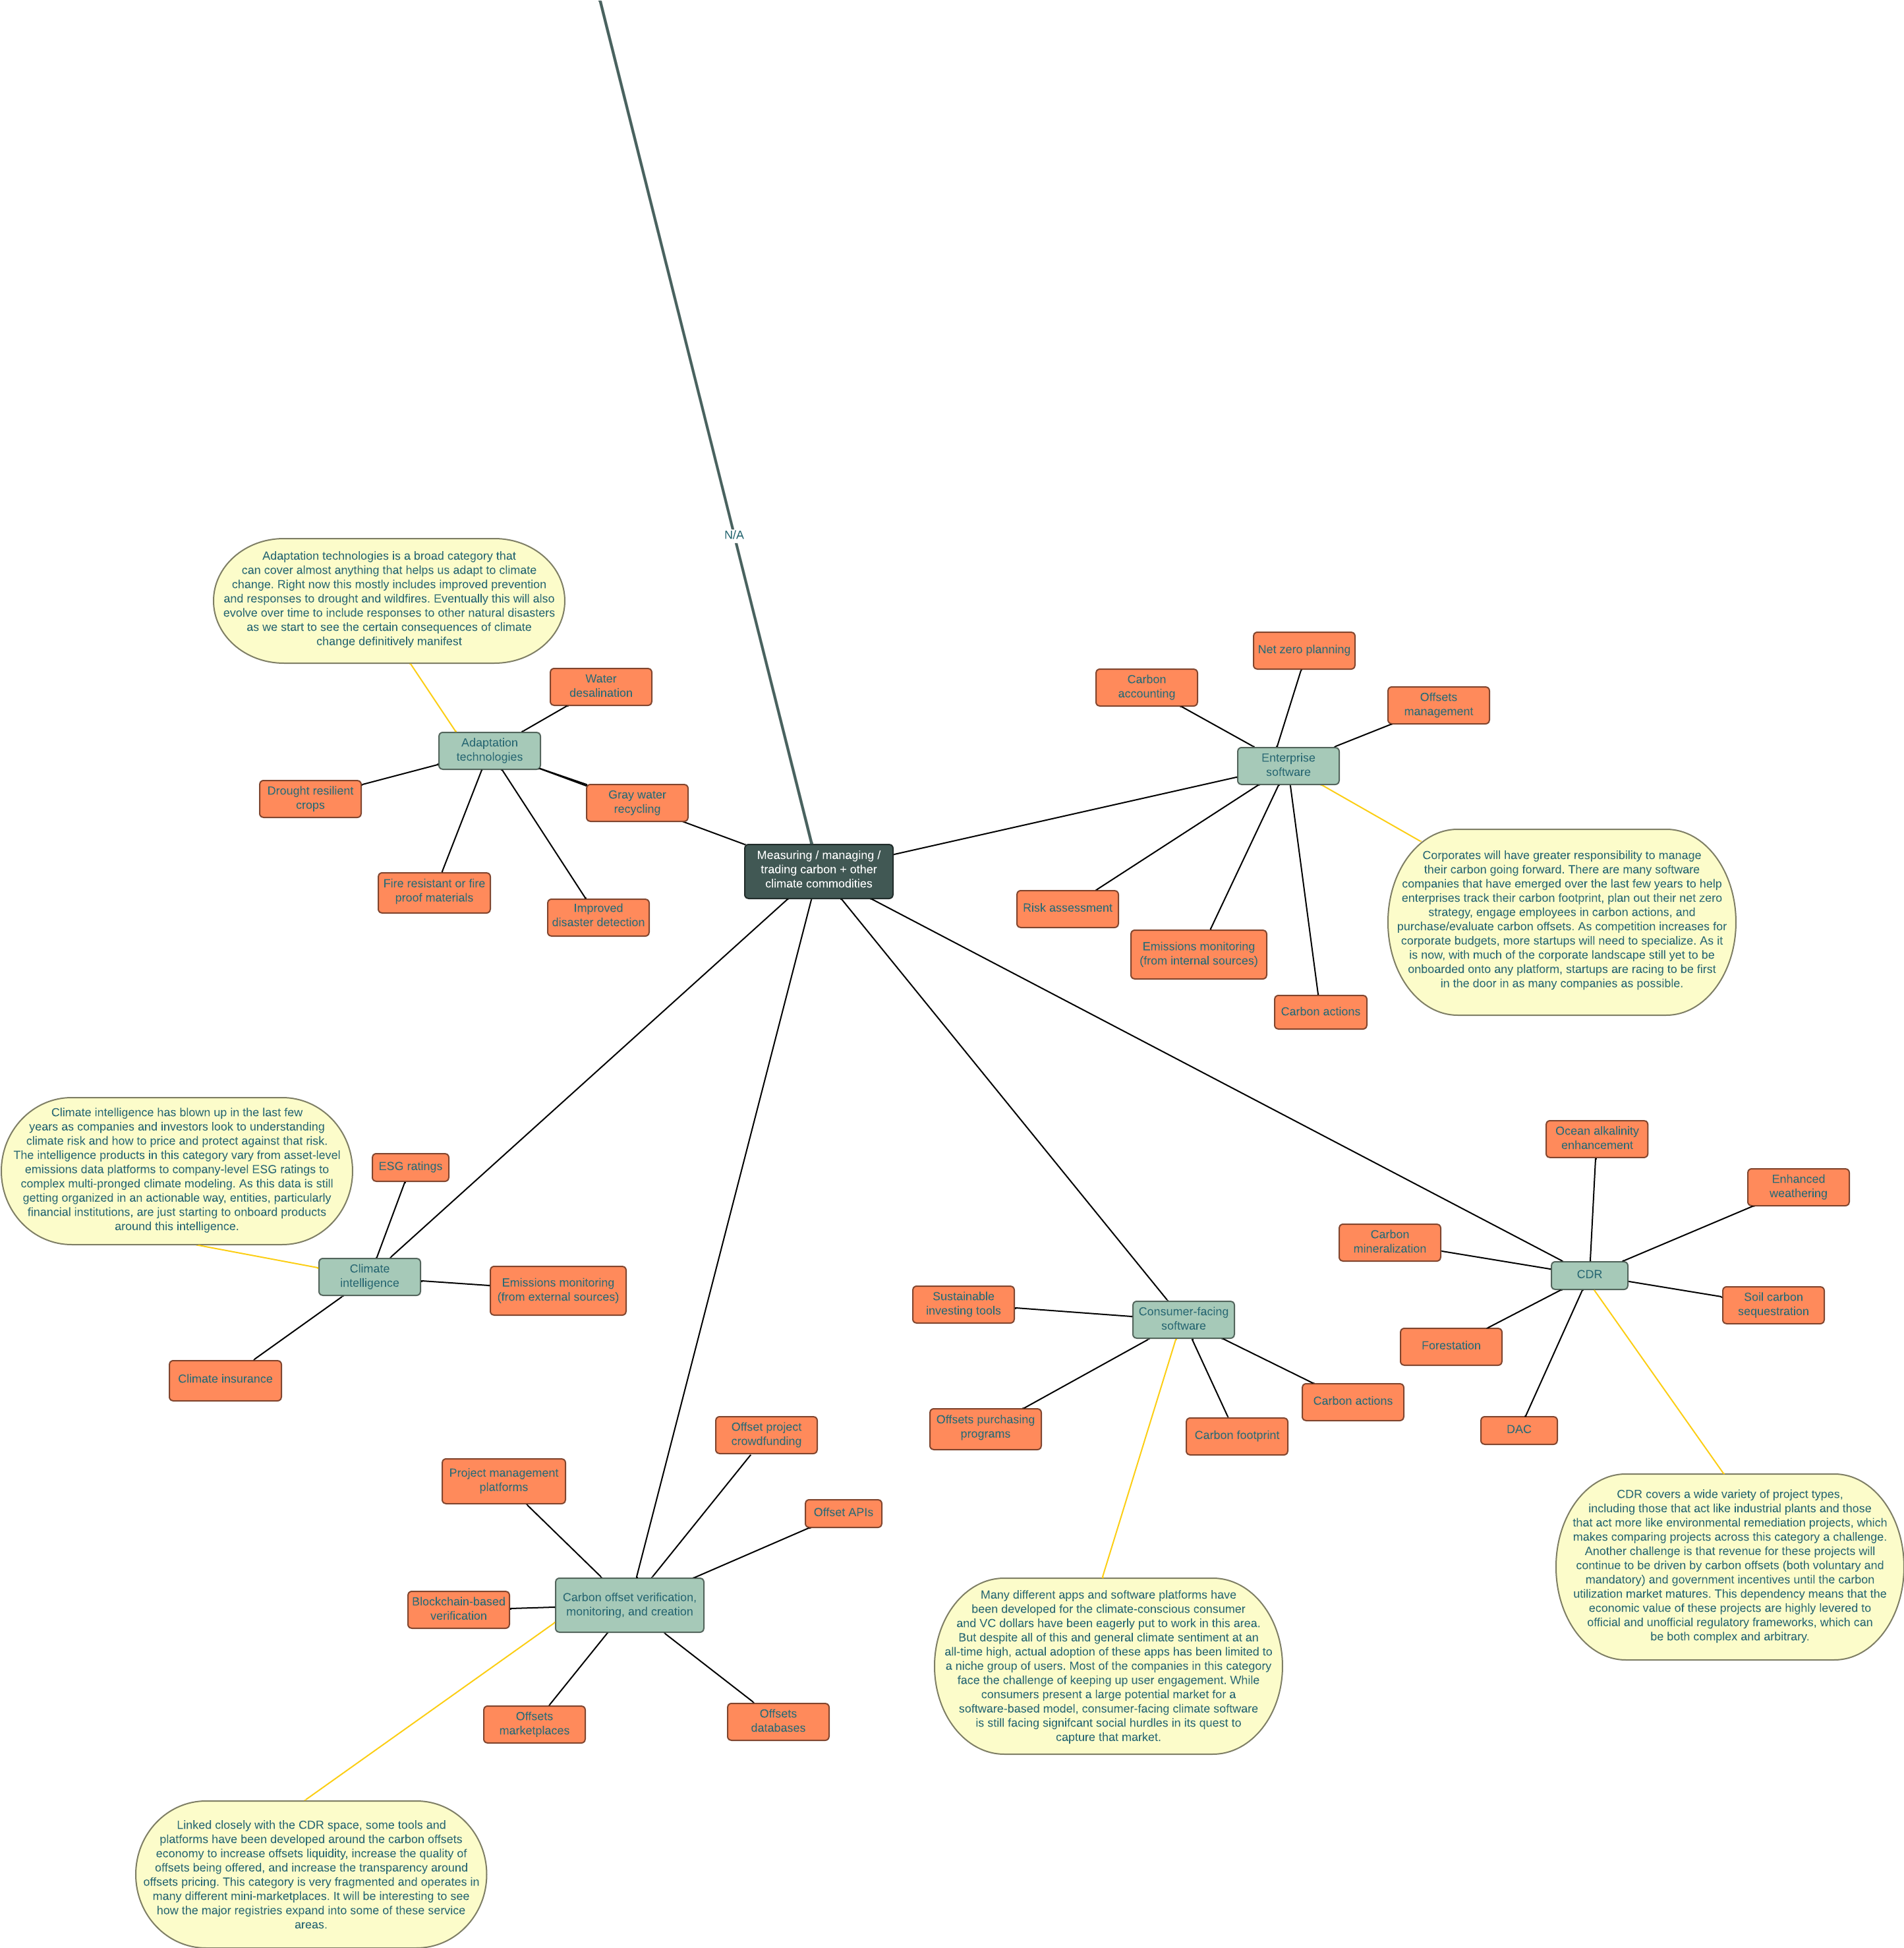
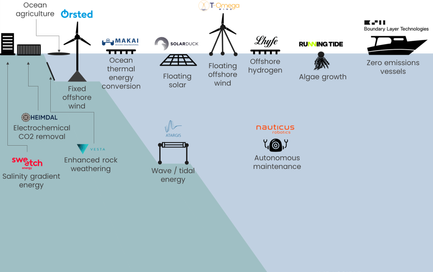
As a reminder, FEST is a framework, inspired by Bill Gates' book, that illustrates the impact of climate tech on the different parts of how we live. Emissions can broadly be divided into Food (F), Energy (E), Stuff (S), and Transport (T).
I use this chart as a reference for looking at the different climate technologies in the context of the broader picture. It's by no means comprehensive...at least not yet! This current version has ~170 nodes, with each node representing a niche of climate technologies.
Updating this has generated some interesting ideas for me of what to write about this year. I hope it's as helpful for you as it is for me.
Transport
Ag/Food
You might also like
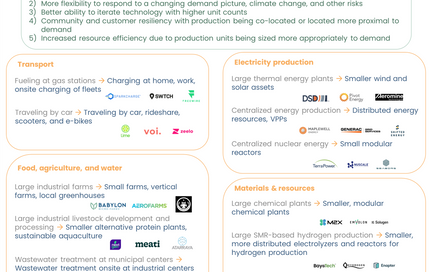
Climate tech theme to watch: decentralization
3 min read
Apr 6, 2023
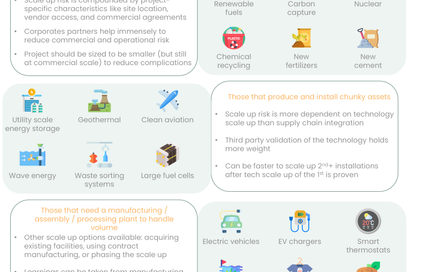
3 different types of first commercial facilities
4 min read
Sep 8, 2022