
After last week’s look at commercial facilities that have been successfully funded, I wanted to better understand what projects in the future will need large first commercial facility (or large first-of-a-kind / FOAK for short) funding.
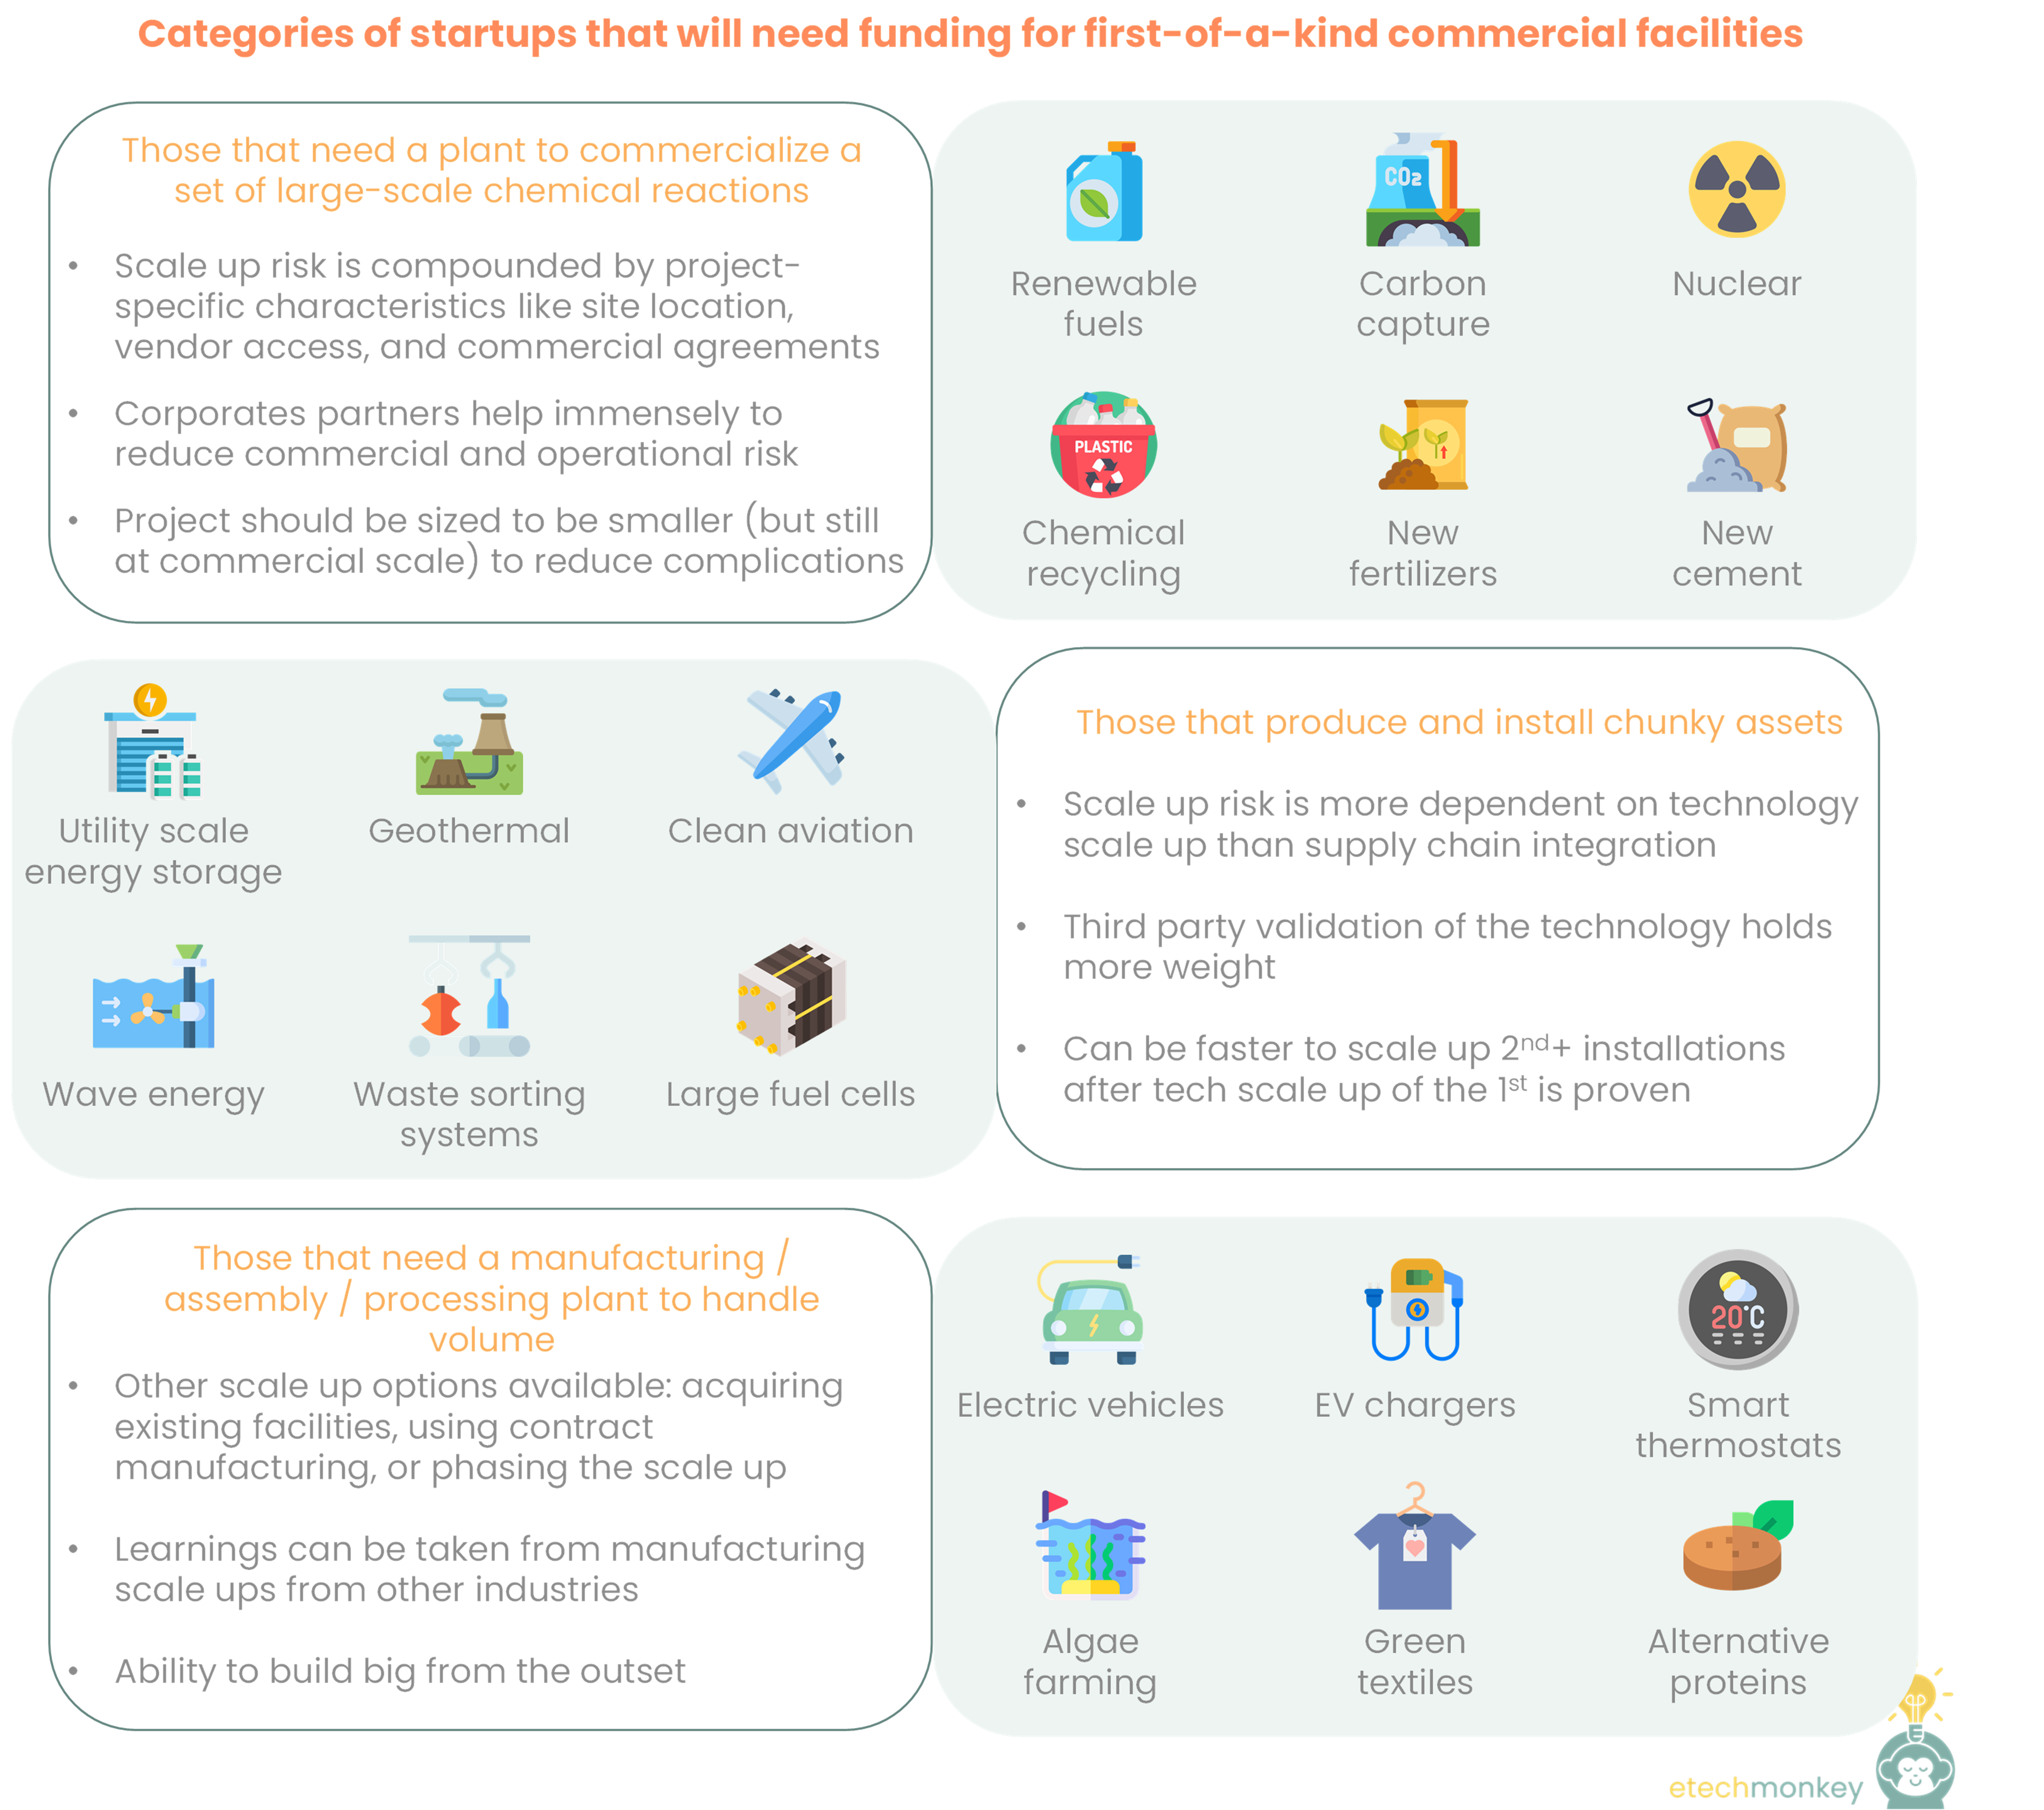
I went through the list of hard-tech climatetech technologies and think there's ultimately 3 types of startups that will need FOAK funding.
In order from most scale up risk to least scale up risk, assuming technology risk is equal:
These categories aren’t necessarily mutually exclusive. A company that builds an automated waste sorting facility may also need a manufacturing facility for robots (see AMP Robotics). A company that that installs large flared gas-to-datacenter systems may also want to manufacture its data centers (see Crusoe). (By the way, these two were not included in last week’s list because their FOAKs were <$50mm.) But most startups that are still commercializing their technologies are only contemplating FOAK in one of the three categories.
So what’s the point in knowing these categories? Understanding which category a startup lands in when planning out a FOAK commercial project can help identify a peer group with a similar scale up risk profile. Perhaps there are milestones and timelines that can be informative for early stage project planning, best practices that can be used between companies in each category, or benchmarks that can be used to help pitch the project risk profile to investors. Since the universe of FOAK commercial is so limited in climatetech, being able to creatively find a peer group to help tell the story is more important than in other industries.
There are also different recommendations I would make for capital raising in each category:
Those that need a plant:
Those that need a large installation:
Those that need a manufacturing facility:
Would love to hear:
If you're a startup - does this framework make sense to you? Or is there another category that's missing? If you're looking for FOAK funding or thinking about your FOAK plans in the future, I would love to connect.
If you're an investor - are there different or additional recommendations you would give for each of these categories?
If you're part of a corporate - are you or have you contemplated the types of partnerships described above?
The scaling problem in hard asset climatetech is well-known and well-documented…valleys of death, unfit capital, project development challenges, etc. etc. Technologies that require some kind of plant, facility, or large chunky infrastructure to be built struggle the most with scaling. Here's how the ease of funding curve looks across a company's maturity (thanks, Lanzatech):

Initial funding for these technologies, if in small dollars, is relatively plentiful. For R&D and prototyping, startups can access grant funding and traditional VC capital (as well as capital from family offices, corporate VCs, incubators & accelerators, and other entities that surround the VC ecosystem).
After the technology has been prototyped and shown to work at lab scale, engineering work can take it to the next level and show that it can be used in the real world. Engineering work can mean expanding the team to include more engineers and/or contracting third parties like EPCs or labs to perform feasibility studies. Larger VC dollars can fund engineering work, though the pool of VCs that can write a later stage check for a pre-commercial tech is more limited than at the earlier stage.
Pilots and first demonstration assets / facilities are where the capital stacks start to detract from the normal VC ecosystem. Funding for pilots and demo facilities can edge into really late stage VC to growth equity levels of capital. Activities like permitting, buying construction materials, hiring a construction agency, adding plant personnel, etc. are expensive. Since the goal of this stage is to make sure the technology works and to prove out the engineering work, the plants are smaller, limited in connectivity to commercial outflows like roads or the grid or customers, and operate only for a fraction of the time. I’ve found that most of the “mature” hard tech climatetech companies with big plants to build are at this stage. This is especially true for the battery industry. Several of the names that have gone public via SPAC over the last few years – Solid Power, Quantumscape, FREYR, SES – are still undergoing pilots.
After the technology has been validated at smaller scale in the real world, both the technology and business model need to be proven together in building the first commercial version of the asset or facility. As we reach the trough of the growth curve, this is the hardest step to get funding for but the one that derisks the company the most. Building a commercial plant requires the capital of a pilot or demo facility scaled up to the point where the economics make sense + capital for additional personnel to run the plant or asset full time + capital for processes or certifications to enable the product to be sold commercially + capital for logistical infrastructure like trucks, roads, pipes, or other conveyances + capital for contingencies, unplanned downtime, regular maintenance….the list goes on. This step attracts investors looking for cash flow, which means that the technology has to be derisked, the financial model has to be airtight, and there has to be a high degree of certainty that revenue will occur.
Post-first commercial, companies can access the much larger pool of capital: private equity, infrastructure capital, and project finance equity and debt. These capital pools don’t have enough climatetech opportunities at their desired maturity levels and check sizes. A startup that reaches this stage usually has enough leverage to get pretty advantageous economics.
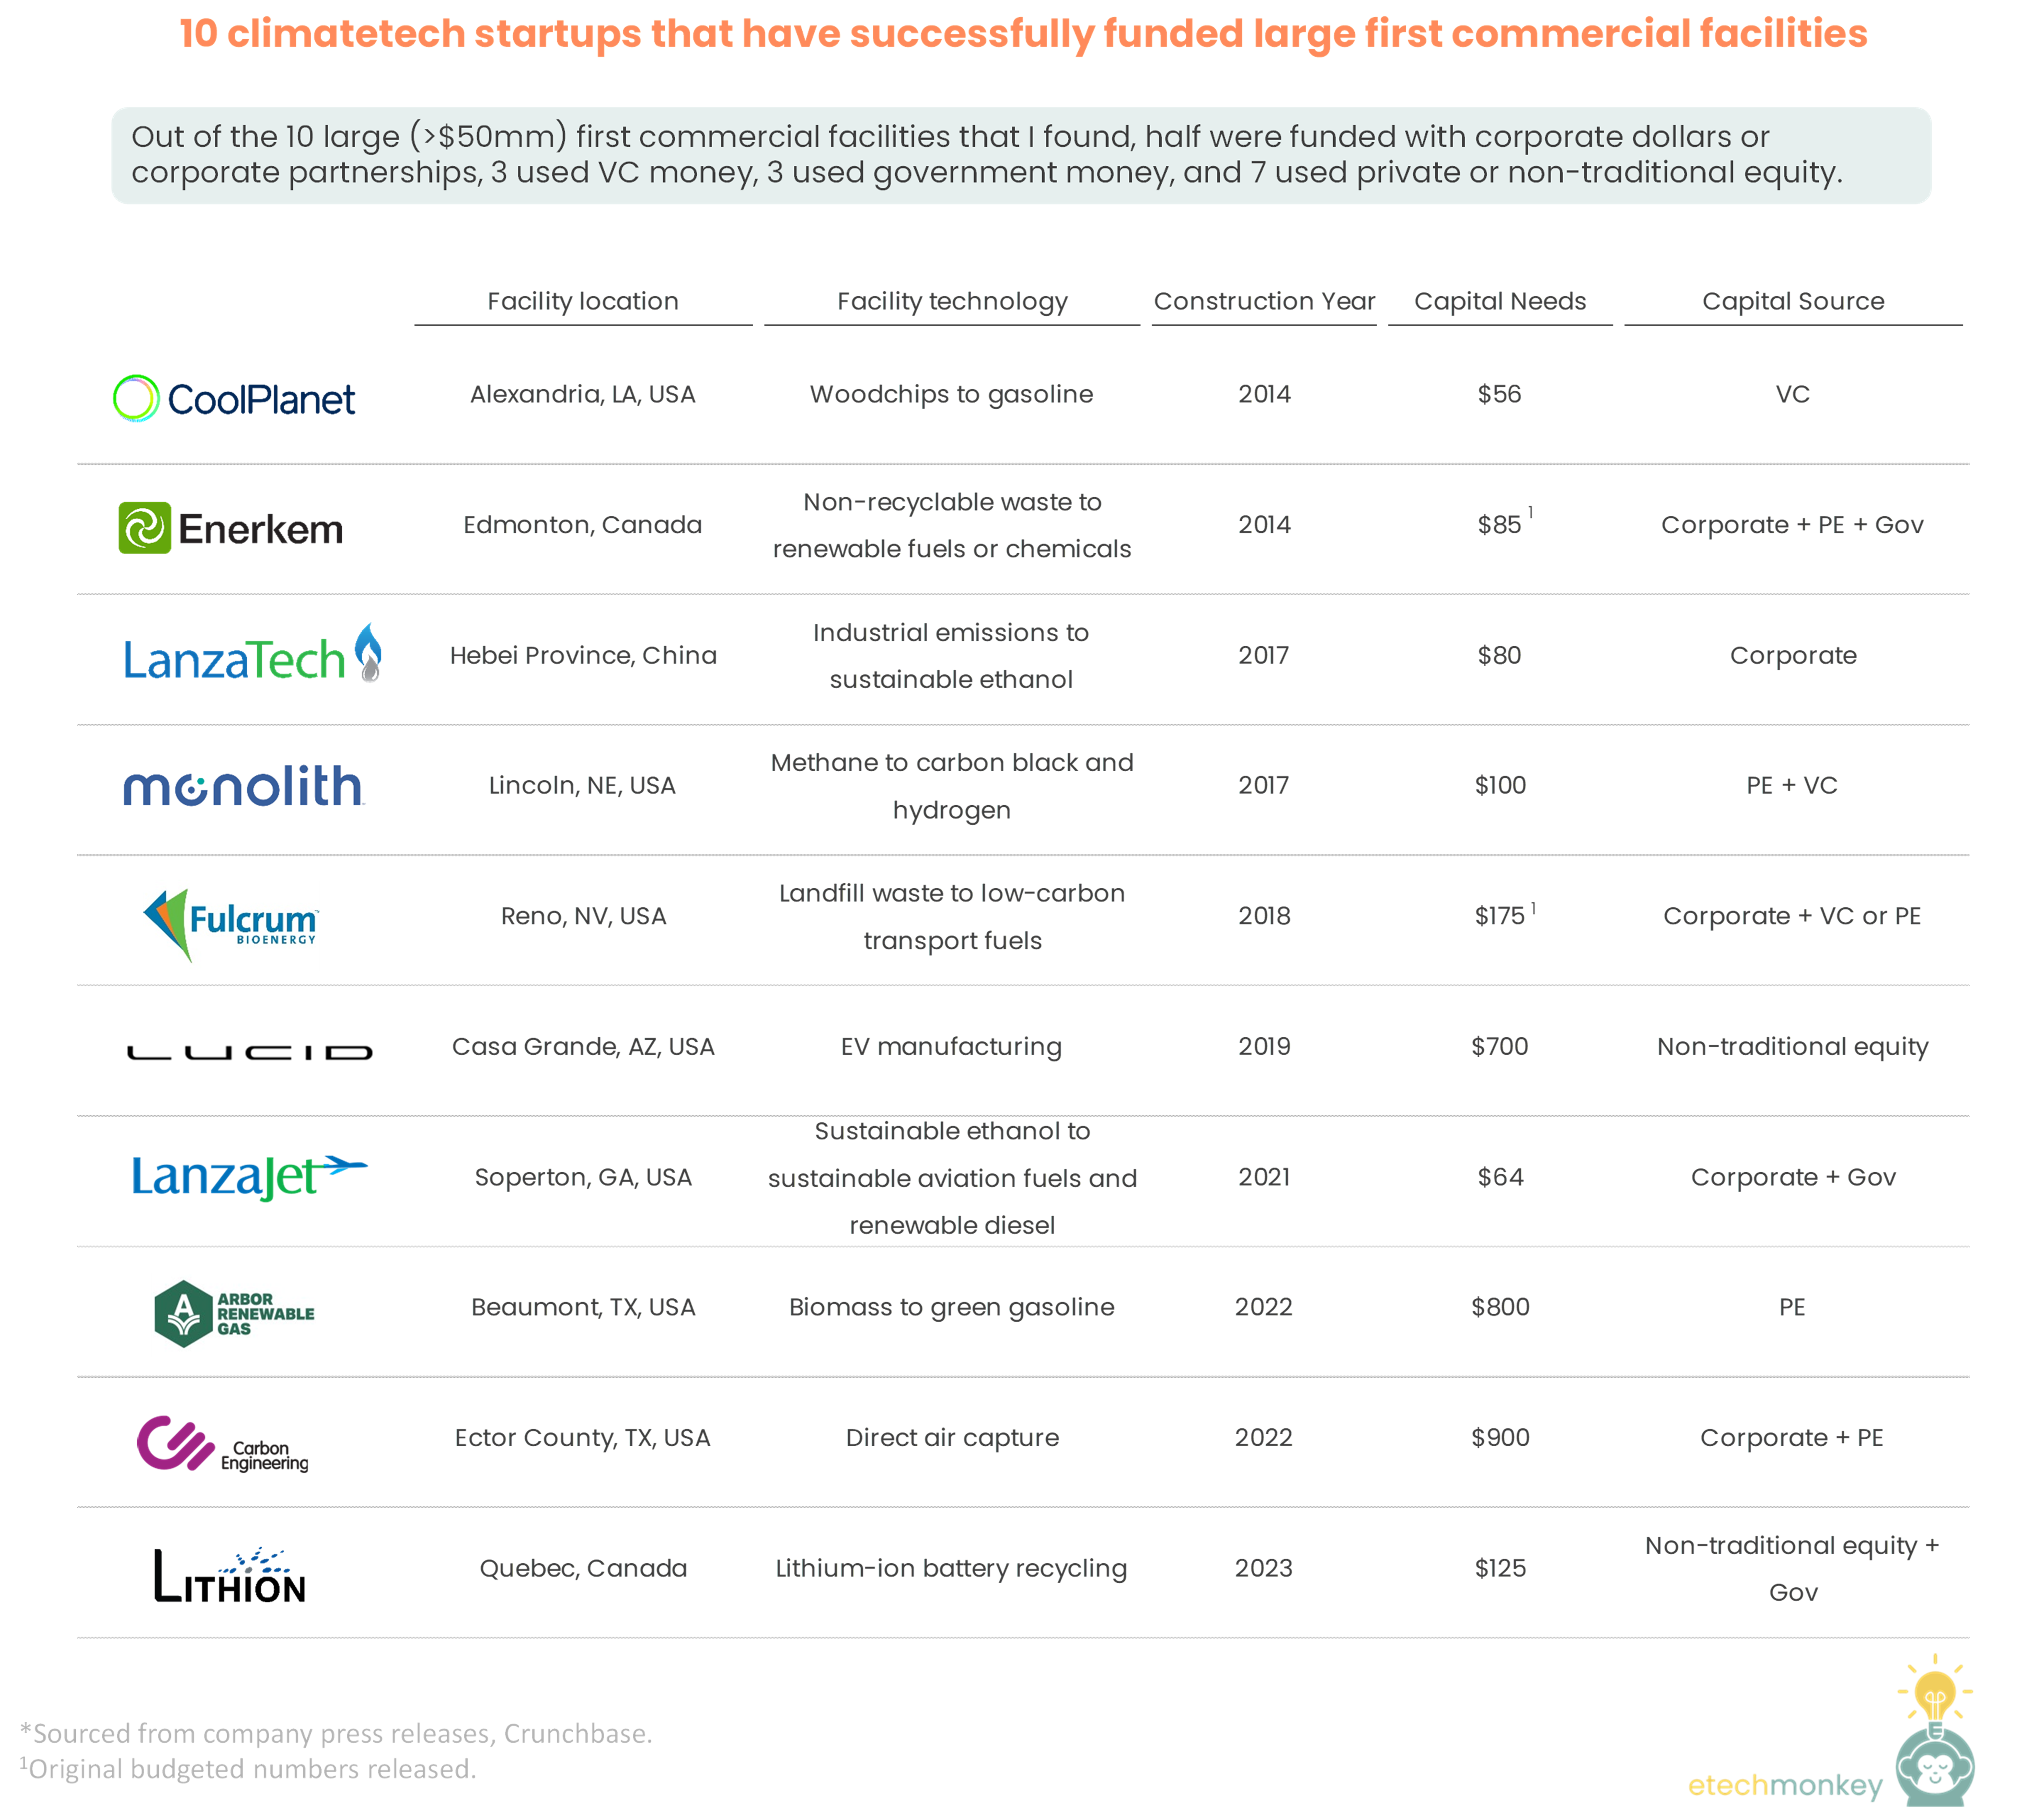
I wanted to better understand how a startup can get past that first commercial trough – are there any learnings that we can glean from past projects? To do this, I set out to collect examples of large commercial facilities (requiring >$50mm in capital) that have been funded climatetech.
Unfortunately, they were very difficult to find. My ideal dataset would be 30+…but I could only find 10.
Companies: CoolPlanet, Enerkem, LanzaTech, Monolith, Fulcrum Bioenergy, Lucid, Lanzajet, Arbor Renewable Gas, Carbon Engineering, Lithion
Some observations:
TLDR; funding for large first commercial facilities has limited precedence. As climatetech scales to need a greater number of large first commercial facilities, companies should look to the fuels space for learnings, corporate and tech-forward private / non-traditional equity for sources of capital, and acquisition of existing facilities as an alternative strategy.
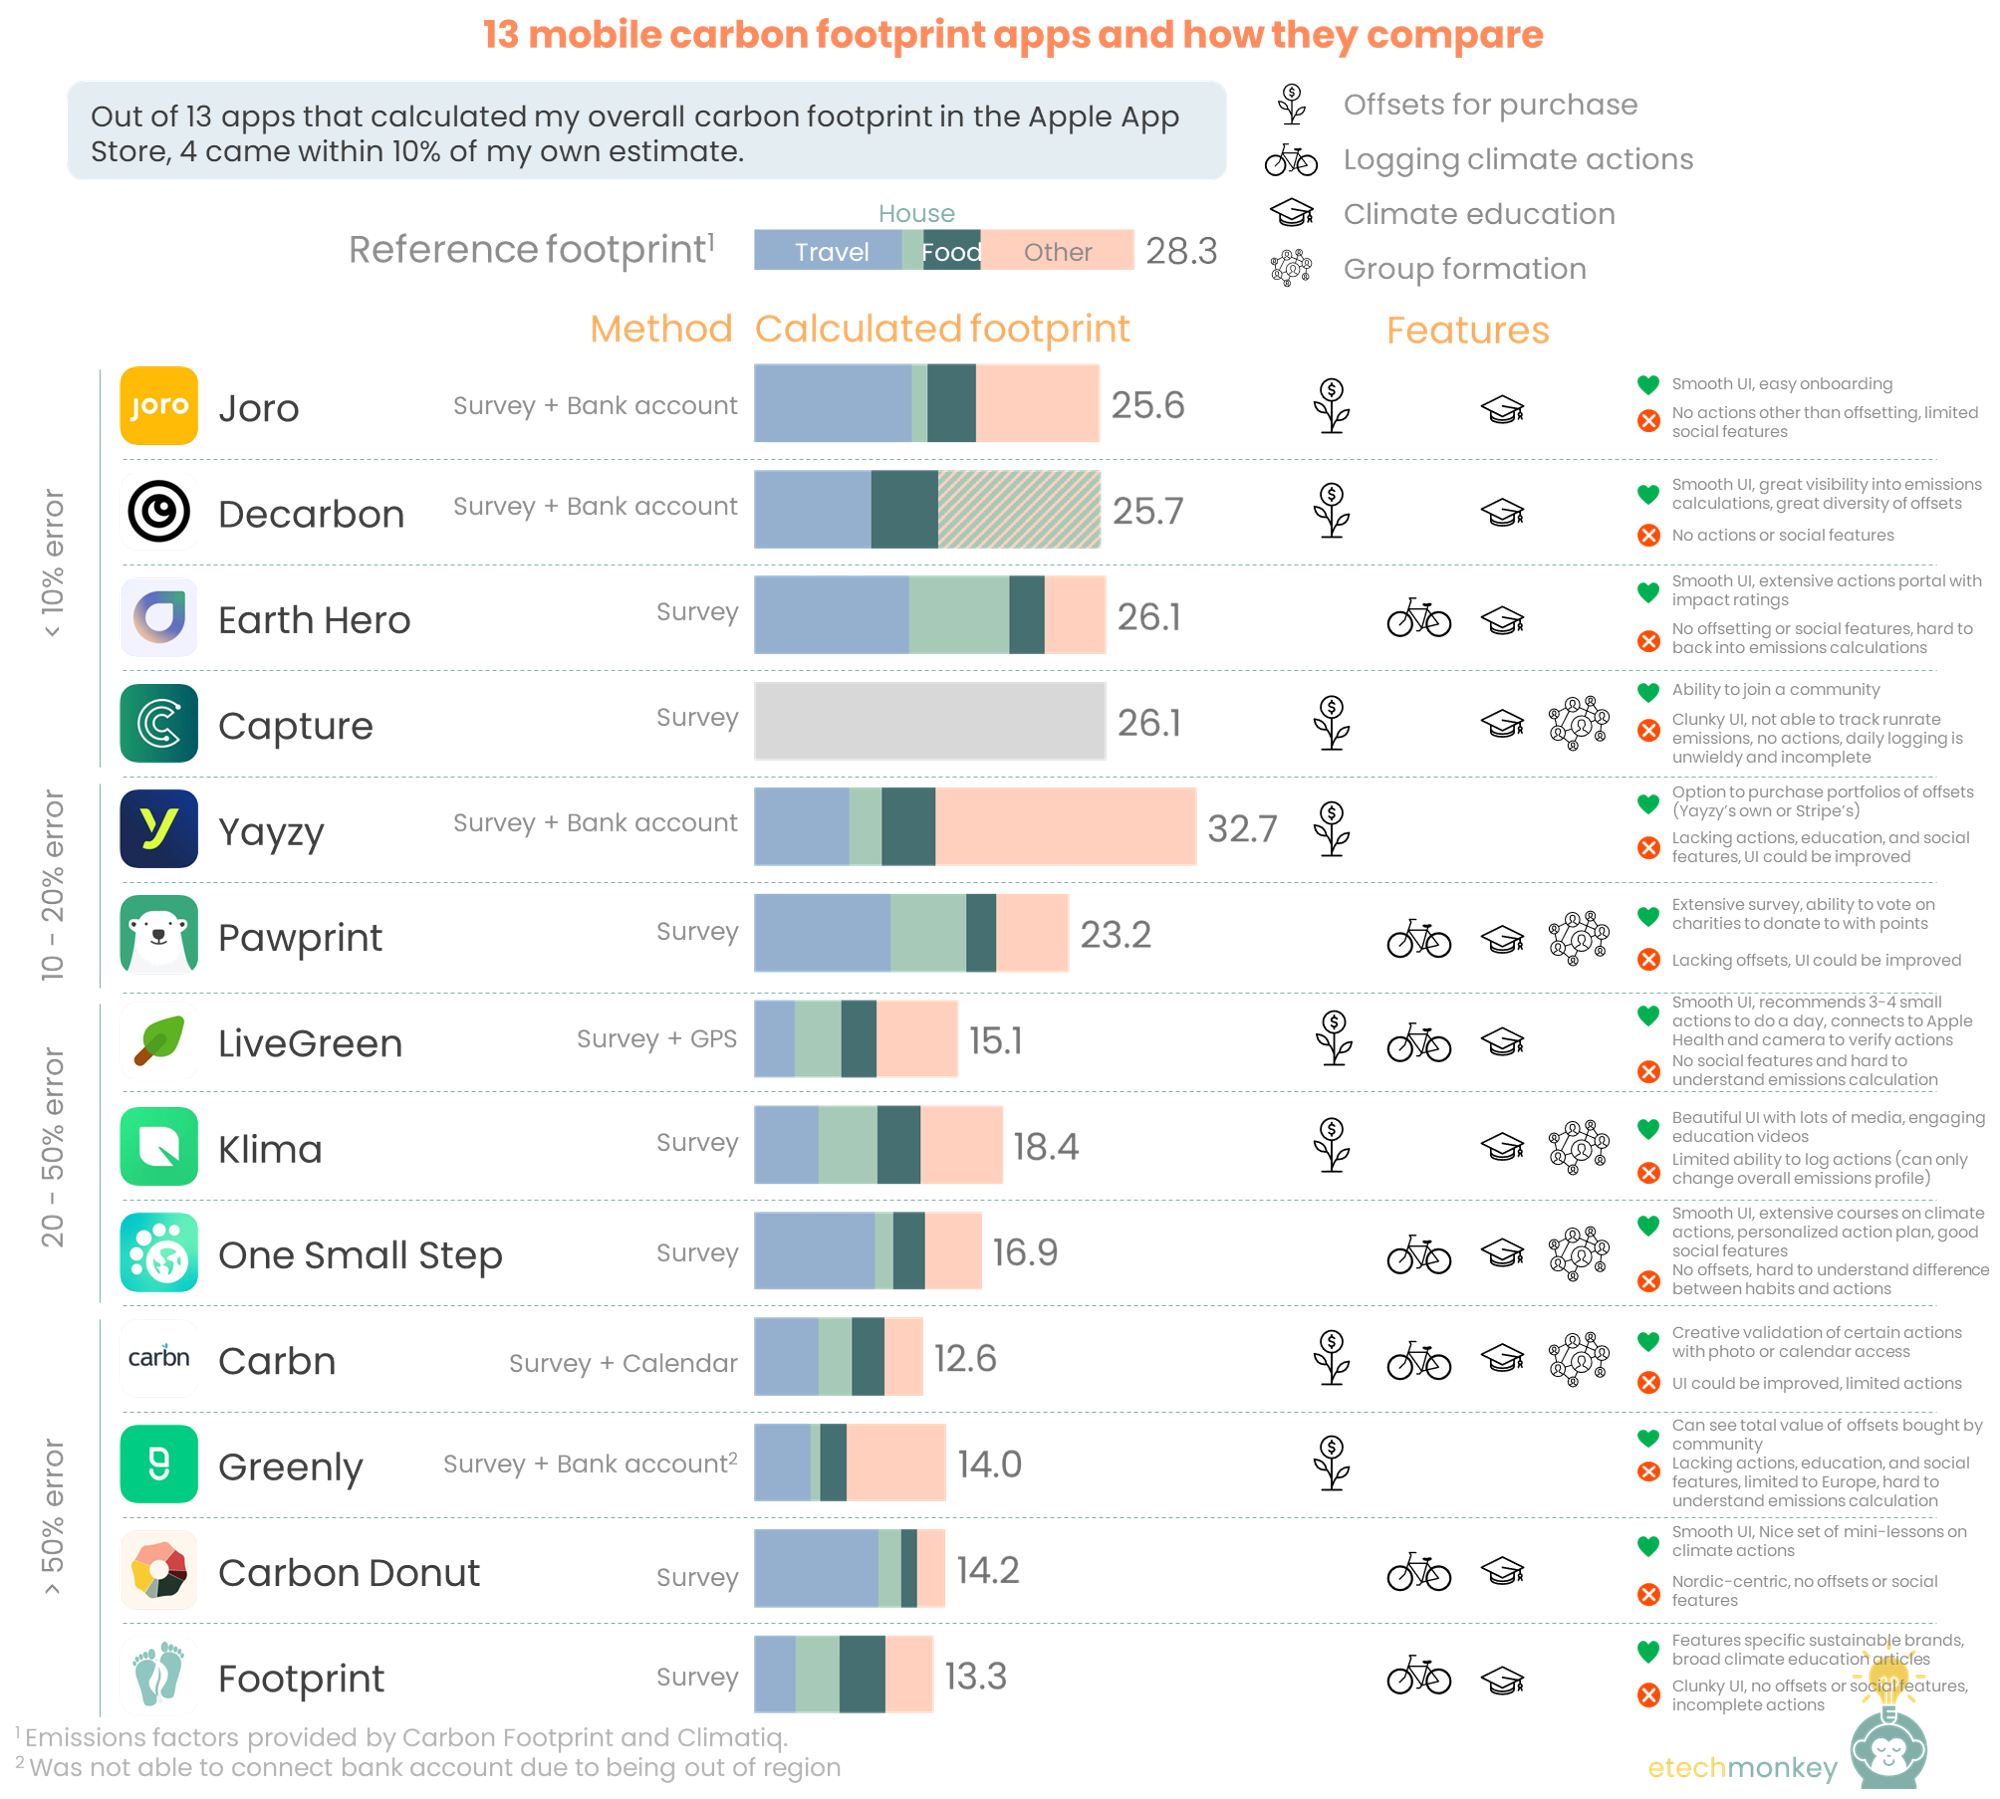
Back to carbon footprinting! So after exploring carbon footprints around the world, how carbon footprints scale with wealth, and the general ecosystem of consumer sustainability software, I wanted to try out some of the consumer footprinting apps for myself.
First off, I had actually calculated my personal footprint using the same method from the previous posts. That served as a baseline for judging the accuracy of an app’s calculations. I’ve estimated my personal footprint to be ~28 tons (yikes!), with “splurge” categories being travel (flying about once a month), food (eating out), and discretionary purchases (this year has been a bit expensive because of moving but I also have an Amazon problem). For context, 28 is about twice the US median and in line with the average carbon footprint of someone in the upper middle class. It’s also 22x where the average person in developed nations should be by 2050. In other words, I’ve got my work cut out for me. And hopefully the apps can help!
I actually downloaded 21 apps to start off with. But six out of the 21 did not work for me for various reasons (CarbonTracker – couldn’t create an account, Earthly – couldn’t connect bank account, GreenFoot – clunky survey, SWRM – ungainly logging of individual actions, Offcents – not available in my region, Personal Carbon Footprint – was unable to load profile again after completing the survey). Another two out of the 21 were not included in the analysis to avoid an apples to orange comparison. Those two were Aerial, which tracks flight and rideshare emissions with email access, and Wren, which is a web app.
The rest, 13 apps, all successfully calculated current emissions but with varying degrees of accuracy. 4 out of the 13 were within 10% of the 28 number, 2 landed at around a 15-20% error rate, 3 had a 35-50% error rate, and the remaining 4 exceeded a 50% error rate. Most apps used surveys as either the main form of gathering data for emissions or as an accompaniment to bank account data.
The features of all of them also varied. 8 apps sold carbon offsets, 7 apps allowed the user to log carbon actions, 11 apps offered the user climate education in some form, and 5 apps included social features like group formation and group competitions.
A summary of my comparison below:
Links to the apps (add me as a friend!):
After using all of these apps for a period of time, here’s what I observed:
TLDR; The personal carbon footprinting market is still small. There are things that can be improved in the apps around accuracy, usability, and features offered. But knowing and understanding my footprint number was a valuable exercise for me as a consumer.
On Tuesday, President Biden signed into effect the Inflation Reduction Act. In the last two weeks, I’ve looked at the climate-related credits and the methane emissions reduction fee in the bill. This week, I thought I might be returning back to the topic of carbon footprinting and away from the thrilling world of tax policy…but the question around the EV adoption was nagging me so much that I needed to look into it. So here we go.
For the most part the IRA is extremely positive, but as mentioned before, the EV credit is the one credit that seems regressive compared to the previous credit, limiting the credit with North American assembly, battery sourcing, buyer income, and MSRP requirements. Summary below:

Overall, some concerning effects about the new credit:
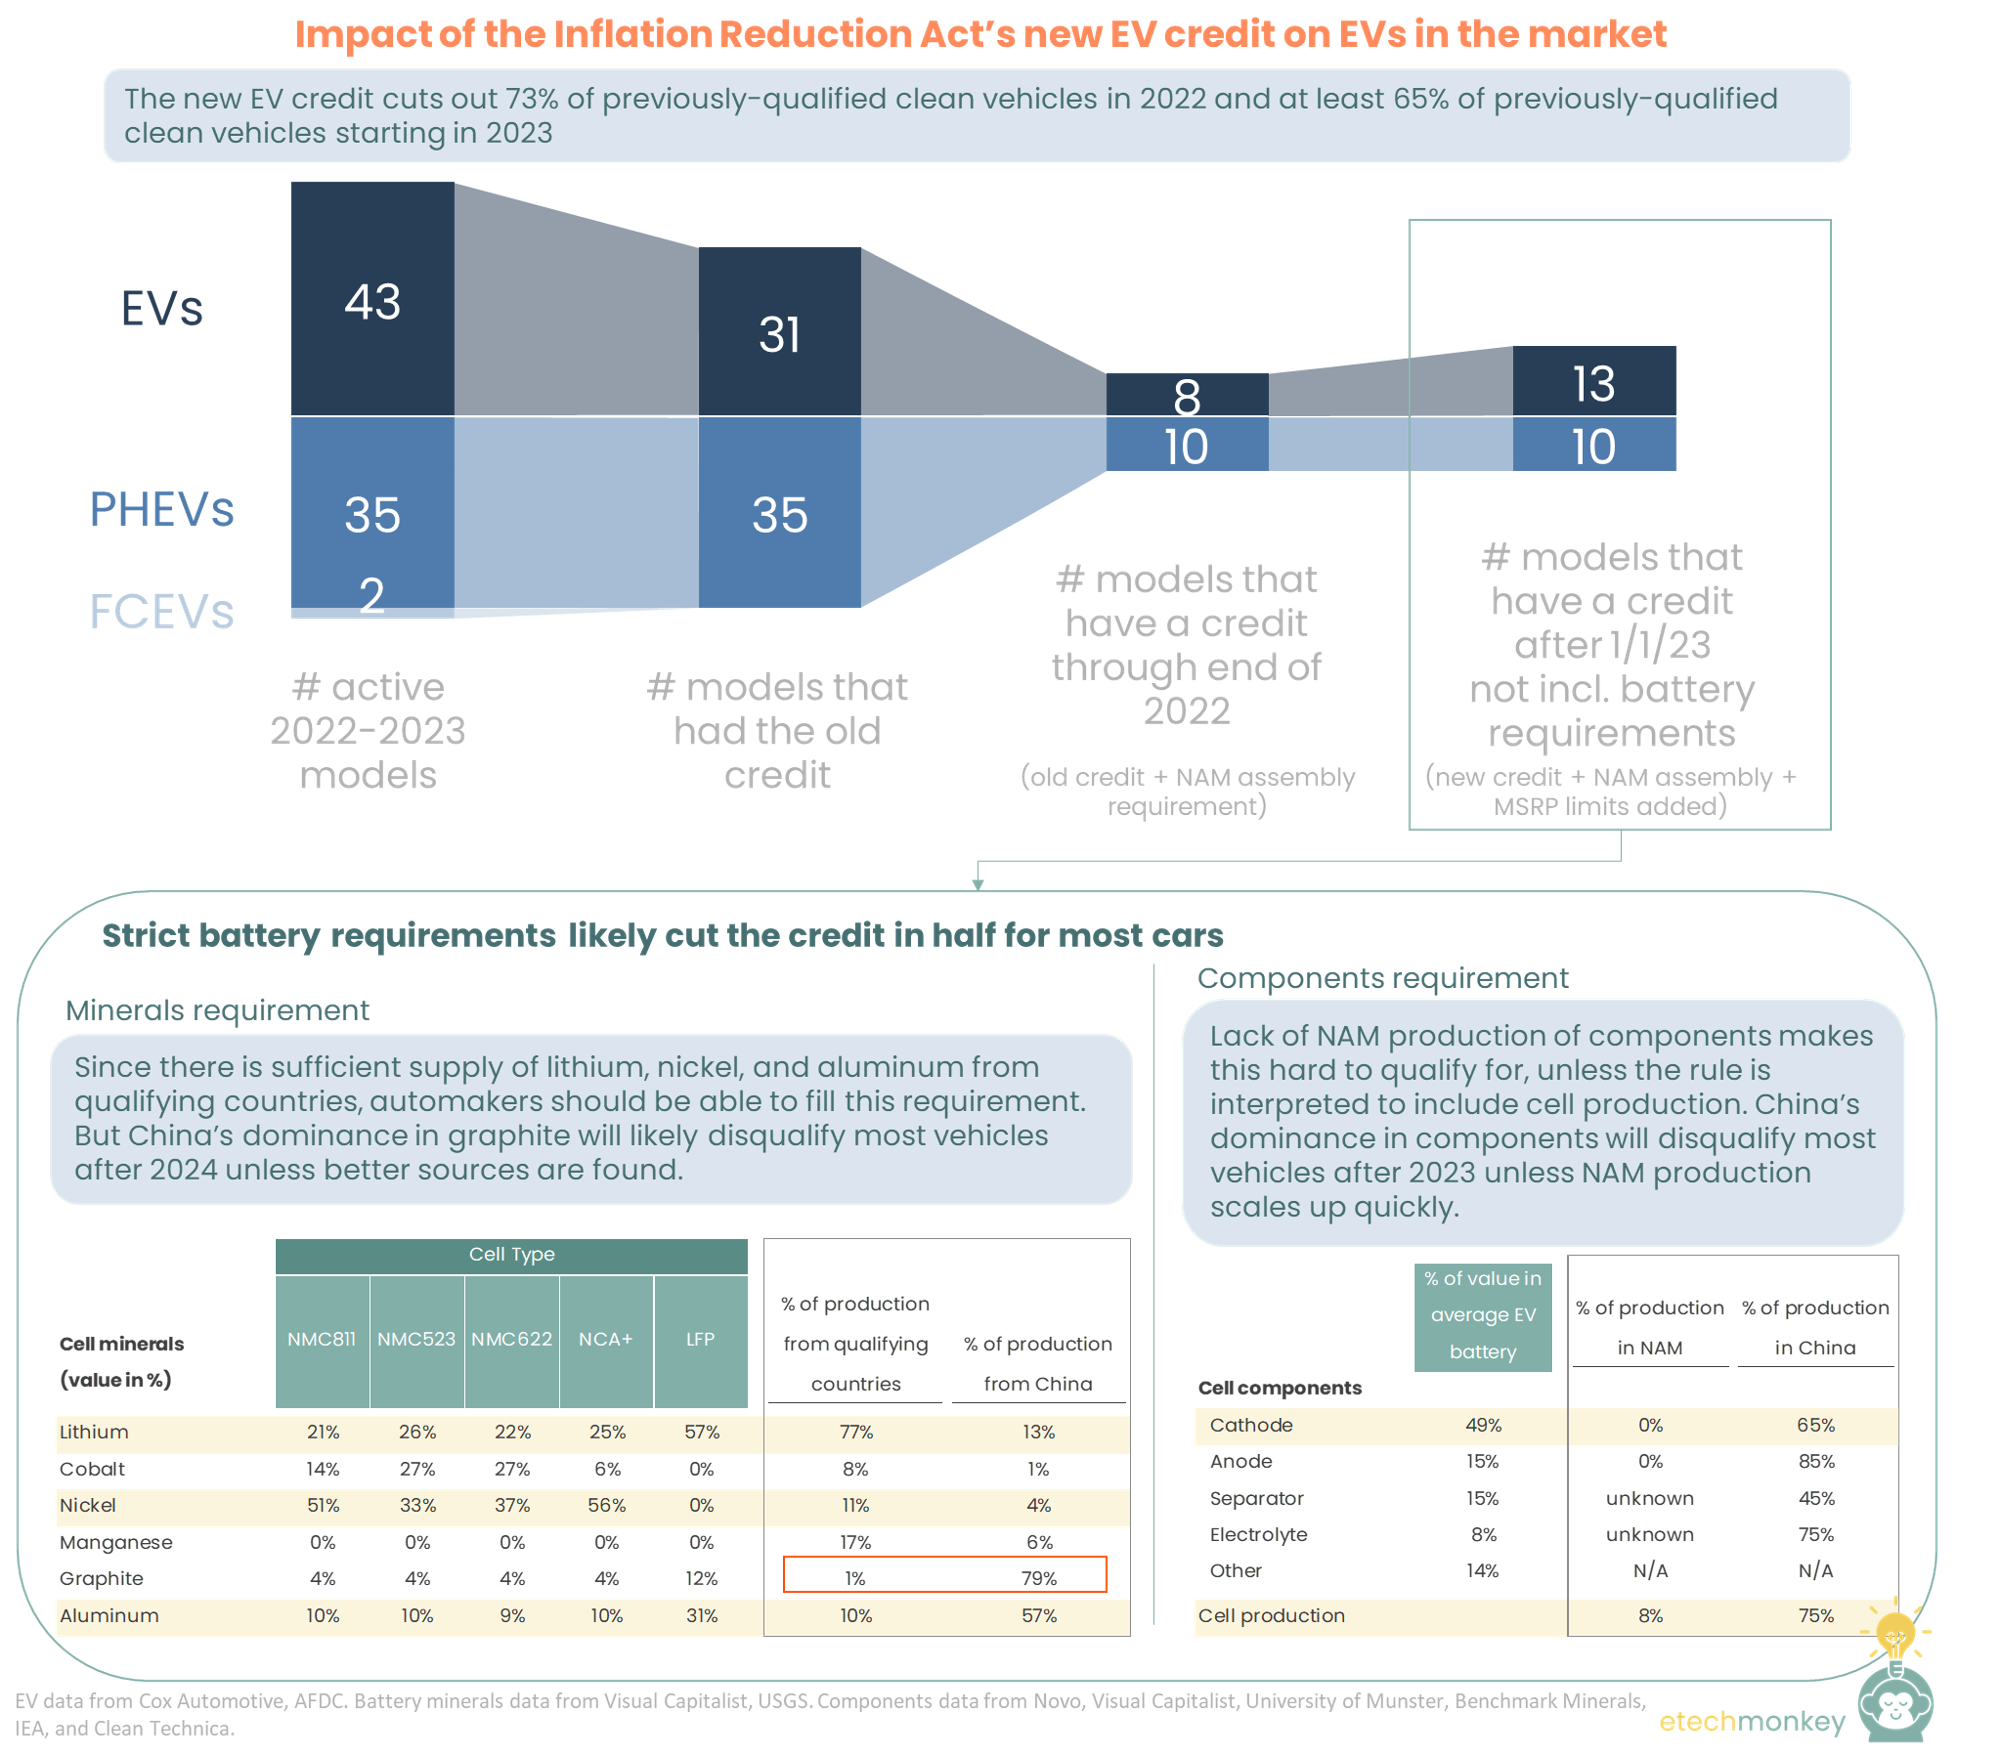
The bill cuts out 73% of previously-qualified EVs/PHEVs in 2022 and at least 65% of previously-qualified EVs/PHEVs starting Jan 1, 2023. The remaining EVs/PHEVs are (unsurprisingly) mostly American.
Out of the 80 EVs and PHEVs that we know are actively being produced for 2022 and 2023, 66 or 83% qualified for the credit (all or some portion of $7,500 depending on battery size and whether the manufacturer’s cap was met) under the old EV credit rules. The ones excluded previously were all of the GM and Tesla vehicles, which have already passed their 200,000-car manufacturer’s cap + the two fuel cell EVs in production – the Toyota Mirai and Hyundai Nexo – which weren’t included in the EV credit but had their own fuel cell vehicle credit that expired at the end of 2021.
Now, with the new clean vehicle credit:
Assuming the battery requirements are met, those 23 cars consist of:
That’s 18 American cars (5 GM cars + 5 Ford cars + 3 Stellantis / Chrysler cars + 3 Teslas + 2 Rivians) or 78% of the list.
For EV purists, here are the numbers with EVs only:
Out of 43 total cars, 31 or 72% qualified for the old credit (again, 12 had already met the manufacturer’s cap). With the NAM assembly requirement, only 8 cars have a credit through the end of 2022 (assuming VW produces this year’s ID.4s in its new Tennessee factory), a reduction of 74%. With the caps lifted and MSRP requirements added in, and assuming the battery requirements are met, 13 cars will qualify for the new credit starting 1/1/23, a reduction of 58%.
It's possible that more cars will qualify as they ramp up their US factories over time. But this will take at least a couple of years for factories to be built and/or for existing factories to be configured for EV/PHEV production.
The battery minerals requirement is actually achievable near-term, but it will likely push battery pricing and also bias EV battery producers to LFP cells.
For the EVs/PHEVs that do qualify for the credit with the MSRP and NAM assembly requirements, there is still the question of whether they also fulfill the critical minerals and components requirements to receive either half (with one requirement fulfilled) or full credit (with both requirements fulfilled).
The critical minerals requirement states that in 2023, 40% of the value of the battery’s critical minerals must be sourced from the US or countries with a free trade agreement with the US. The percentage goes up to 50% in 2024, 60% in 2025, 70% in 2026, and 80% for 2027 and beyond.
Though the list of critical minerals in the bill is long, only six are material to EV battery composition: lithium, cobalt, nickel, manganese, graphite, and aluminum. The requirement states that the percentage is based on “value” of the critical minerals, which will probably be further clarified by the IRS, but we’ll take to mean market price of each mineral for now. Taking the average composition of minerals in each cell type and multiplied by the market price of each mineral, we get the following matrix:
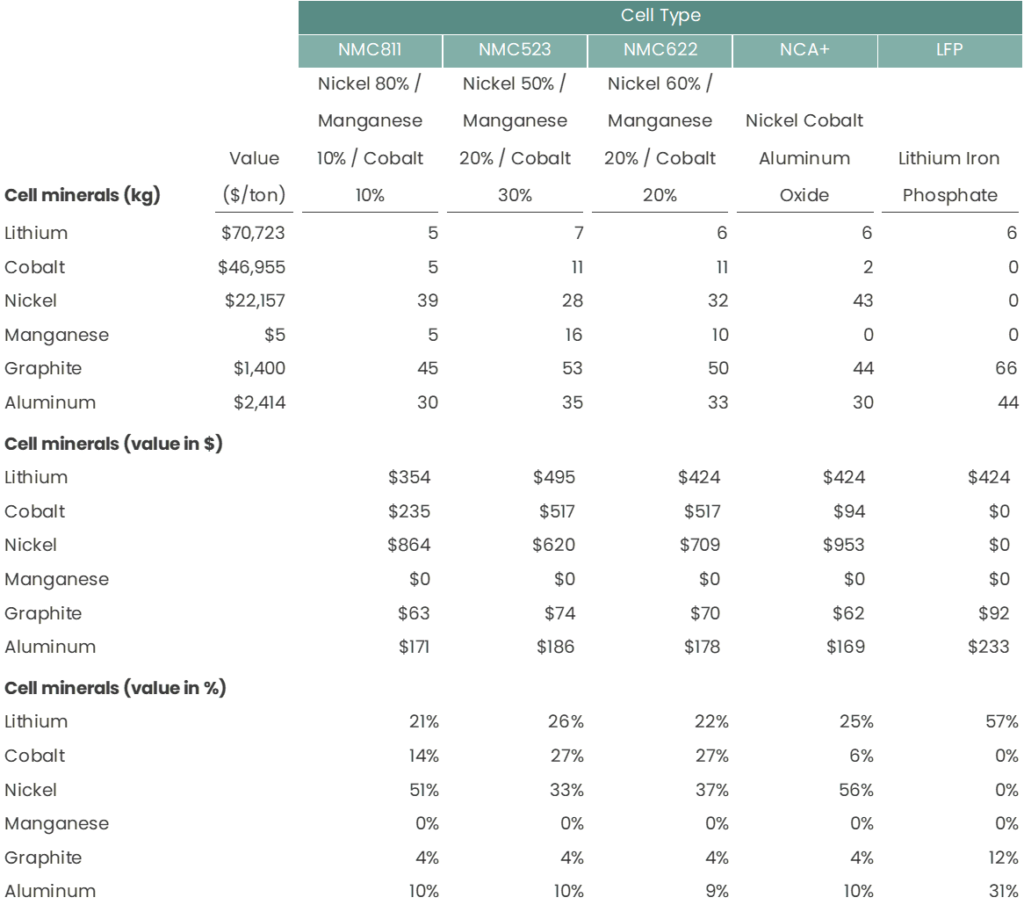
Different battery chemistries have different value mixes and supply chain challenges. For NMC811 and NCA+, the 40% requirement can be fulfilled by sourcing just nickel from the right countries. For NMC523 and NMC622, the 40% requirement can be filled with lithium + nickel or lithium + cobalt or nickel + aluminum. For LFP, lithium alone can fill the requirement. (This is all assuming for simplicity’s sake that each mineral will be sourced from one location. It’s probably more likely that each mineral will come from a bunch of different locations. The IRS has their work cut out for them to figure out the accounting around all of this.)
If we take a look at the production of each of these minerals by country, we can tell how challenging it might be to source these minerals from the US or the qualifying free trade countries. Lithium is by far the easiest mineral to source with 77% of production in countries with free trade with the US (Australia, 52%, and Chile, 25%). Next is manganese with 17% of its production in qualifying countries (Australia, 16%, and Mexico, 1%). Nickel has 11% (Australia, 6%, Canada, 5%, and the US, 1%). Aluminum has 10% (Canada, 5%, Australia, 2%, Bahrain, 2%, and the US, 1%). Cobalt has 8% (Australia, 3%, Canada, 3%, and Morocco, 1%). Finally, graphite has a measly 1% (Canada).
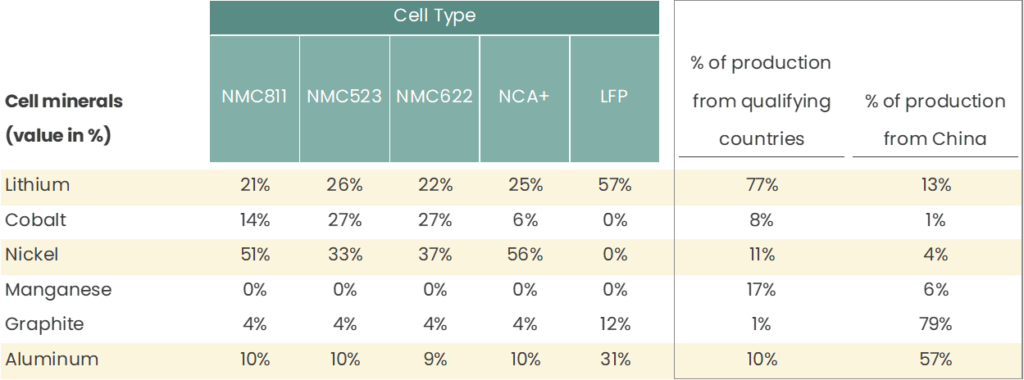
First off, thank goodness for Australia. Without Australia’s lithium production and their free trade agreement with the US, most EVs would be screwed.
Second, if we combine this sourcing info with the minerals value matrix above, we can guess that most companies will be relying on lithium + nickel or lithium + nickel + aluminum sourcing to fulfill the requirement. 38% of lithium demand is for EVs at this point, so with 77% of production in the right places, there should be more than enough lithium supply now from the right countries to fill the requirement. The same can be said for nickel, though it’ll be more of a squeeze: nickel for EVs only compose 3% of the nickel market so vs. 11% of production, there should be enough supply for now (it’s probably enough of a shift for prices to go up though). Finally, aluminum is extremely abundant and presents little issue. Current aluminum demand for batteries represents <1% of aluminum production so vs. the 10% production number, manufacturers should have options.
The point is - theoretically, there’s enough production to source battery minerals from qualifying supply sources. Whether manufacturers are already doing that and if not, how long it takes for them to shift to the right supply sources, is a different question. Also, since most EV batteries are NMC, if shifting supply drives nickel pricing up, we may see overall EV pricing go up as well.
Finally, because of LFP batteries’ abundance of minerals concentrated in lithium and aluminum, it’s possible we see an accelerated shift to LFP by automakers to ease supply chain burdens and do more business with US-friendly countries. Tesla already uses LFP batteries in its Model 3 and Model Y base models and will probably qualify for this part of the credit as a result.
Graphite will be an issue for most EVs after 2024
A caveat to the above statement is that part of the battery minerals requirement is that no minerals or components will be sourced from a foreign entity of concern (China, Russia, Iran, or North Korea) in 2024+ (2025+ for minerals, 2024+ for components). For graphite, this is a big issue.
82% of graphite currently comes from a foreign entity of concern (79% from China, 3% from Russia, and 1% from North Korea). That’s vs. 33% of graphite that’s used for battery production. And because of graphite’s dominance in battery anodes, anode production is also concentrated in foreign entities of concern (mainly China with 85%), placing the components requirement in danger too.
If we don’t find another source of graphite, it’s possible that the majority of EVs will lose the credit either after 2024 because of the graphite sourcing or after 2023 because of anode sourcing.
The battery components requirement is trickier to get near-term
IRA requires that at least 50% of battery components to be manufactured or assembled in North America. This increases to 60% in 2024 – 2025, 70% in 2026, 80% in 2027, 90% in 2028, and 100% in 2029 and after.
65% of cathodes, 85% of anodes, and 76% of battery pack cells are manufactured in China, which does not bode well considering any included components from China after 2023 will disqualify cars from receiving the credit.
The percentage that the credit will be based on is also, similar to the minerals requirement, tied to the “value” of the components. It’s a bit more difficult to figure out what “value” means in this context and if the IRS will reach into individual supply agreements to figure out pricing for each component (hard to imagine that being practical). It seems like several sources (Novo, Visual Capitalist, University of Munster, Benchmark Minerals) point to the cathode being anywhere from 30 – 67% of the cost (depending on cathode pricing), the anode another 15%, the separator anywhere between 10 – 20%, and the electrolyte 5 – 10%. To get to the 50% requirement, manufacturing at least the cathode domestically seems necessary. Though there have been some announcements (Tesla, GM, Redwood, Lithium Werks) on large scale domestic cathode production, most facilities are in the earlier stages of development, which leaves at least 2 years of limited options for OEMs to qualify for this credit.
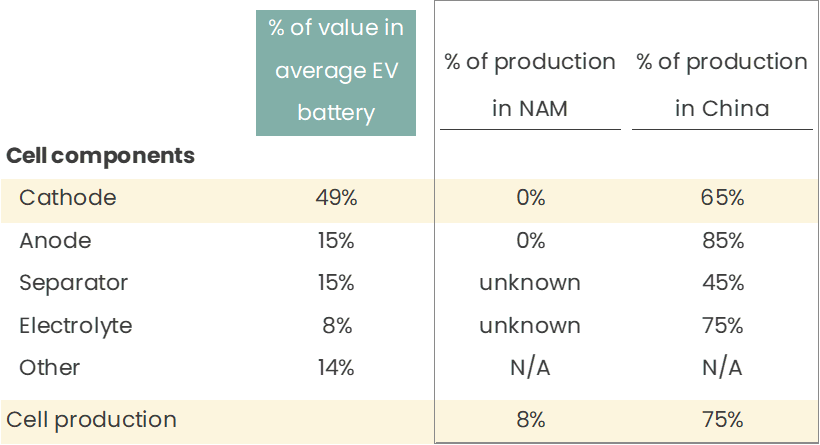
The flip side of this is depending on the interpretation of “manufactured or assembled,” it’s possible that all that matters is that the components are assembled in North America. If that’s the case, then there are existing options. Several OEMs already have cell production in the US (GM, Ford, Tesla), with many more battery cell factories on the way.
So in summary, for the 23 cars that will qualify for the credit after 1/1/23, I’m…
…which translates to the average credit being $3,750 until 2024, when most credits will turn to $0 because of foreign graphite/graphite anode production.
Hope I’m wrong and the IRS issues guidelines that totally turn over these interpretations, qualifying more cars.
A few more observations:
This credit favors existing automakers and handicaps emerging ones
The sucky thing about this credit is that it removes the credit for some automakers at the critical launch point vs. later on when the cars have had enough consumer traction to grow on their own.
The two fastest growing EVs this year behind the Tesla Model 3 and the Model Y are the Hyundai Ioniq5 and Kia EV6, both relatively new EVs that have launched in the last year or so and both no longer qualifying for the credit. With an average EV premium of ~$10k, the lack of credit will this price point out of the reach of many consumers that have been considering these cars. Personally, I myself have been looking for a good AWD EV and am struggling a bit to justify paying $51k for an AWD Kia EV6 vs. a $38k fully loaded AWD Kia Sportage (I don’t even get surround view or a sunroof in the former). That sentiment is echoed across many different forums that I follow (r/electricvehicles, r/KiaEV6, r/Ioniq5) and I suspect that this will reflect poorly in Q3 and Q4 sales numbers going forward.
The problem is exacerbated for startup companies. Rivian is set to barely qualify for the credits with their base models but their higher margin near-term deliveries will exceed the MSRP caps. Fisker and Polestar both don’t fulfill the NAM assembly requirement and won’t get the credit. For a startup OEM, slower sales in the beginning has an outsized negative impact on further growth, limiting their ability to generate cash flow to reinvest in further growth or raise more money from investors. An incumbent OEM has 1) the advantage of being able to eat some of the losses of a lackluster launch with their other product lines and 2) the advantage of an existing brand and consumer traction to support their EV growth.
With the new credit favoring existing automakers with the resources to pivot production, source more expensive materials, and/or have enough traction to not need the credit, the startup OEMs have higher hurdles ahead.
This credit also excludes a good portion of buyers likely to buy an EV
The bill imposes income limits of $150k / single and $300k / joint filers to qualify for the credit. While this is reasonable, it does mean that an estimated 42% of EV buyers are now excluded from qualifying for the credit.
Money matters, especially in America…52% of Americans state that cost is a major barrier to getting an EV. 53% of Americans surveyed would NOT pay more for EVs vs. 22% of consumers globally.
A tax credit helps. 35 - 48% of Americans state that they’re much more likely to get an EV with a tax credit.
Again, like most of the requirements in this new credit, it’s hard to say how much the income limits will affect EV adoption…but 42% is a lot of people to exclude. And your average American seems reluctant to overpay for an EV unless it comes with a tax credit. We can only hope that more Americans will see the value of getting an EV despite the cost and/or OEMs will start lowering prices to appeal to the American buyer.
EV adoption in the US will probably slow down
A quick perusal of Reddit provides plenty of anecdotal evidence that consumers are rethinking EVs with the (lack of) new credit, but how much will this actually slow down EV adoption?
The good news is that most of the recent US transactions are from cars that will continue to have the credit going forward (or at least some credit, depending on the minerals and components requirements). 66% of 1H 2022 y/y growth in EV/PHEV sales were driven by 16 cars that will qualify for the new credit (mostly Tesla and some Jeep and Ford PHEVs).
That does leave 34% of growth without a credit though…and that 34% of growth represents 43 car models. This portion of the pie has also been growing much more quickly, boasting a CAGR of 119% vs. the credit-carrying group’s CAGR of 57% over the last 10 quarters.
Many estimates have EVs growing to ~30 – 50% of US new car sales by 2030. At the low end, that represents an additional 4 million car sales vs. 2021 numbers. If the credit-carrying category keeps up a 28% annual growth rate until 2030, we can theoretically reach this number without needing other models. And so far, that category has been posting CAGRs much higher, so maybe we’re ok.
But if we assume that the projections slow Tesla growth to a more mature growth rate, as EVAdoption has done, then we’ll more likely need 3.5 million cars from other OEMs by 2030. 2.5 - 2.8 million of those cars will likely be from non-credit carrying cars. If the lack of EV credit slows down adoption of these cars by 5% a year, we’ll be looking at closer to 25% of new car sales by 2030 instead of the currently projected 30%. If it slows down adoption by 10% a year, that’s 22% of new car sales by 2030.
So yes, this credit will probably have a negative impact on EV adoption. The numbers CAN be compensated by more aggressive growth assumptions for Tesla, GM, and the other automakers that do qualify for the credit, but that’s only if these automakers can deliver on production and sell more to consumers with lower incomes.
Basically - we’ve either crippled our adoption by a few percentage points OR placed a large portion of our bets on a few companies to help deliver on 2030 projections.
TLDR; the new EV credit, while likely to help boost domestic manufacturing and sales of US car brands, does so at the expense of EV adoption. It will make EVs more expensive for the consumer by limiting supply chain, handicapping competition, and removing the credit for a good chunk of EV buyers.

Last week I did a review of the new IRS climate credits in the Inflation Reduction Act (Sections 13101 through 13802). The other climate-related portions of the act (Sections 21001 - 23003, 30001 - 30002, 40001 - 40007, 50121 - 50303, 60101 - 60506, 70001 - 70002, 80004) cover appropriations to states and government agencies for various programs (home rebates, EV manufacturing, electric transmission, air pollution, etc.) with loose guidelines as to use of funds. For a more detailed list of what funds are assigned to what programs, check out the CTVC database.
I didn’t focus too much on these sections since how those funds will be deployed out of those agencies is still currently unclear. It’ll take time for these government agencies to figure out their rules for what projects / entities qualify for those funds. And then it’ll be an additional step to figure out how to enforce those rules in a practical way. Until then, the impact of these parts of the legislation are hard to judge.
That being said, Section 60113 is worth discussing.
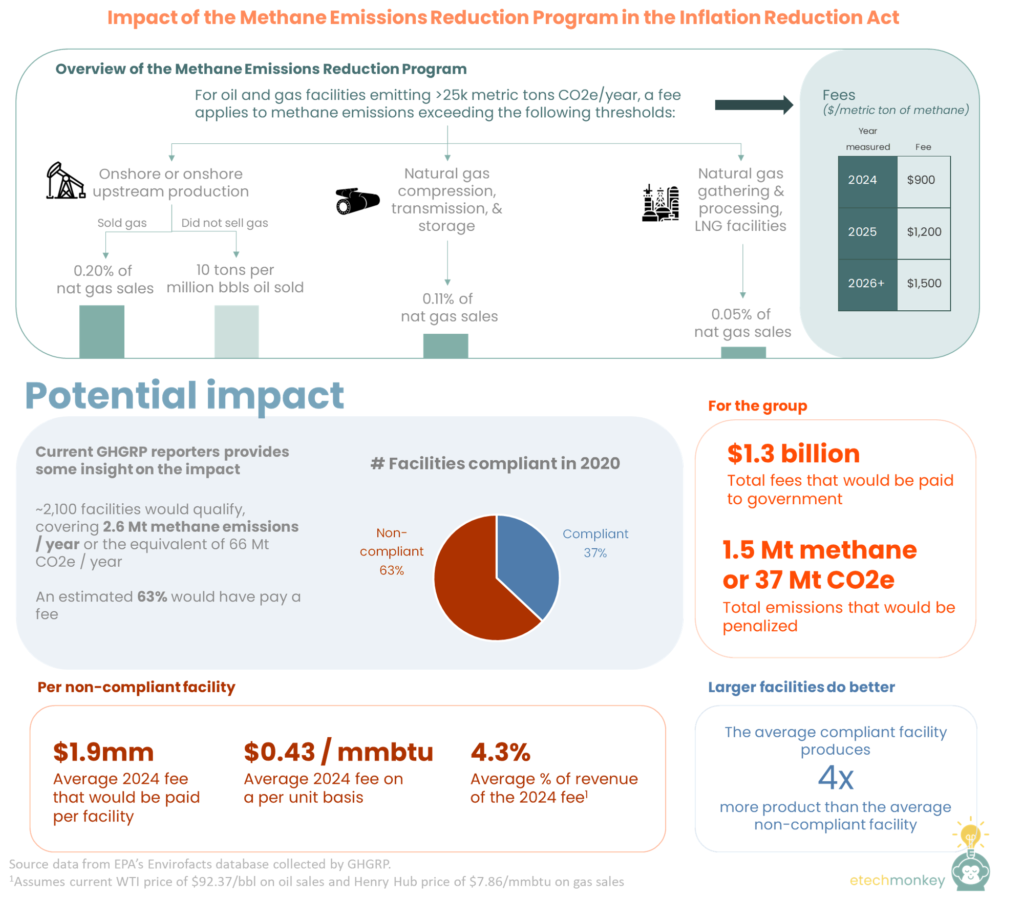
Section 60113 is a methane tax on the oil and gas industry. It places a methane fee on oil and gas facilities that report >25,000 metric tons of CO2e / year. For whatever emissions exceeds the emissions threshold for that facility, the charge would be:
The emissions thresholds are as follows:
There’s also an exception built in to exclude facilities that that are already regulated by state-level methane emissions requirements, provided that those requirements would result in emissions reduction equal or greater to those that would be imposed by EPA’s proposed rule from last year.
Using current GHG reporting, the potential impact from this fee is 37 Mt CO2e, maybe less
The >25,000 metric tons of CO2e / year is the same threshold used by the EPA to determine eligibility for facility-level GHG reporting, so we actually have an idea of what emissions would be subject to this new tax.
In 2020, the 2,103 qualified oil and gas facilities that reported to GHGRP emitted a total of 0.3 Gt CO2e / year. Of that amount, 77% or 0.2 Gt CO2 are from CO2, and 23% or 0.07 Gt CO2e (which is equivalent to 2.6 Mt methane) are from methane. To put this in context, the total emissions in the US right now is 5.8 Gt CO2e, so the covered facilities represent ~5% of the total.
If we impose the methane fee on the facilities that exceeded their thresholds we can see that an estimated 63% of current facilities are currently not compliant. Those facilities represent ~1.5 Mt methane in excess, or the equivalent of 37 Mt CO2e. With the 2024 fee amount, that’s ~$1.3 billion in fees paid to the government.
The numbers are possibly smaller considering the regulatory exception that may allow some facilities to bypass this fee. Facilities in states like Colorado can follow state regulations instead if the emissions reduction would be greater or equal to those imposed by the currently proposed but not active EPA rule. It’s unclear how that emissions impact would compare to this fee.
The economic impact won’t cripple operators by any means but can be significant
A non-compliant facility on average would pay $1.9mm for 2024’s emissions measurement. That translates to $0.43 / mmbtu or 4.3% of estimated revenue using today’s prices. Though 4% of revenue is no small change, commodity swings can be much larger for oil and gas facilities. Cost structures often take this potential volatility into account and are sized appropriately to be able to handle them. So at today’s prices, the economic impact should be easy for most operators to handle (9 facilities actually would have the fee take up more than 50% of revenue, but those are large outliers).
That being said, commodities do shift quickly and if pricing drops down close to the breakeven, the extra punch from the methane fee could hurt a lot more (average of 12% at $40 oil and $2.50 gas). So hopefully that itself gives operators enough incentive to take emissions reduction seriously.
These thresholds are generally in line with what industry has already set for itself but will incentivize laggards to comply
OGCI, composed of many of the large oil and gas majors, already met its 0.20% methane intensity target in 2020 and is now setting up to have a target of well below 0.20% by 2025.
ONE Future, a natural gas consortium, has publicly stated its goals to be 0.28% / 0.08% / 0.111% / 0.225% for upstream / gathering / processing / transmission & storage. These are much higher than the methane fee thresholds, BUT in practice (or at least in what's reported), the consortia has already reduced its emissions to be well under their goal and the methane fee thresholds. In 2020, they reported 0.11% / 0.04% / 0.02% / 0.14% for upstream / gathering / processing / transmission & storage, which, save for a 0.03% difference in transmission, are in compliance with these new methane fee thresholds.
So for the operators that have already set goals and are working on their methane intensity numbers, this fee should have low to minimal impact on their efforts.
But looking at the wide distribution of methane intensities across operators, there are many that are egregiously off base. This fee would hopefully help push those laggards to keep up with the rest.
The fee doesn’t apply equally, hitting the smaller facilities harder than larger ones
A couple of interesting trends to observe: the non-compliant facilities tend to be smaller facilities, having an average of 48 Tbtu production, more than 4x lower than the compliant facilities (perhaps a factor of the methane intensity goals mentioned above). Offshore facilities also tend to be more non-compliant than onshore facilities. LNG, though with very few facilities in general, is much more compliant than its traditional gas counterparts.
GHGRP under-reporting is a real issue and could handicap the emissions impact
What was confusing to me was the discrepancy in methane emissions accounted for under GHGRP and the methane emissions estimated by EPA’s GHG Inventory (GHGI). According to GHGI, methane from natural gas and petroleum systems account for 0.2 Gt CO2e in 2020, almost three times higher than the 0.07 Gt CO2e that is reported in GHGRP. That’s out of a similar 0.3 Gt CO2e number of total emissions. In fact, for some reason, the proportion of methane emissions reported in GHGRP is switched from the proportion of methane emissions reported in GHGI. I double and triple checked these numbers but couldn’t figure out why these don’t reconcile.
But beyond what could just be a government database problem is the overarching issue with GHGRP emissions accounting. There are more and more studies that point to GHGRP under-reporting for all sorts of reasons - industry non-compliance, bad methodologies, and reporting thresholds that exclude the majority of emissions. That's an issue not only for determining the fees in a rule like this but also for eligibility for GHGRP in the first place. Though GHGRP does put in place some verification procedures and requires operators to document all emissions reporting, there are still plenty of ways an operator can bypass the system, deliberate or not. Once there’s a real monetary incentive to do so, I suspect that under-reporting may be even more prevalent.
The way to counter this is with technology. With better methane monitoring technology will come higher standards for reporting. That will in turn allow EPA to not only verify the emissions numbers more easily but also allow operators better manage their own footprints in real time.
Some companies working on this problem: Project Canary, Kayrros, LongPath, Earthview, Seekops, Qube, GHGSat
TLDR; the methane fee is more of a gentle push vs. a kick in the butt. It likely won't have a big emissions impact, but it will play an important role of pushing industry laggards to catch up with industry leaders that are already setting similar methane intensity targets. Plus it generates an extra $1B for the government.
Taking a break from consumer footprints this week to talk about the Inflation Reduction Act (IRA), groundbreaking legislation for the climatetech world. It was introduced last Wednesday as a substantial revamp of the Build Back Better Act (BBBA). With BBBA-opposer Senator Manchin’s support, this budget reconciliation bill opens back up the possibility of passing key climate provisions introduced back in BBBA.
I’ve taken a (painfully) close read of the bill and summarized the climate credits provisions below. There are additional sections that provide funding for government entities / agencies for specific programs that aren’t covered but that are listed out in other sources, also below.
A few observations first:
Here we go!
(Note 1: I am no lawyer and tried my best to interpret the bill given its language and the other sources mentioned below. If you notice any mismatches with your own interpretation, please give me a shout)
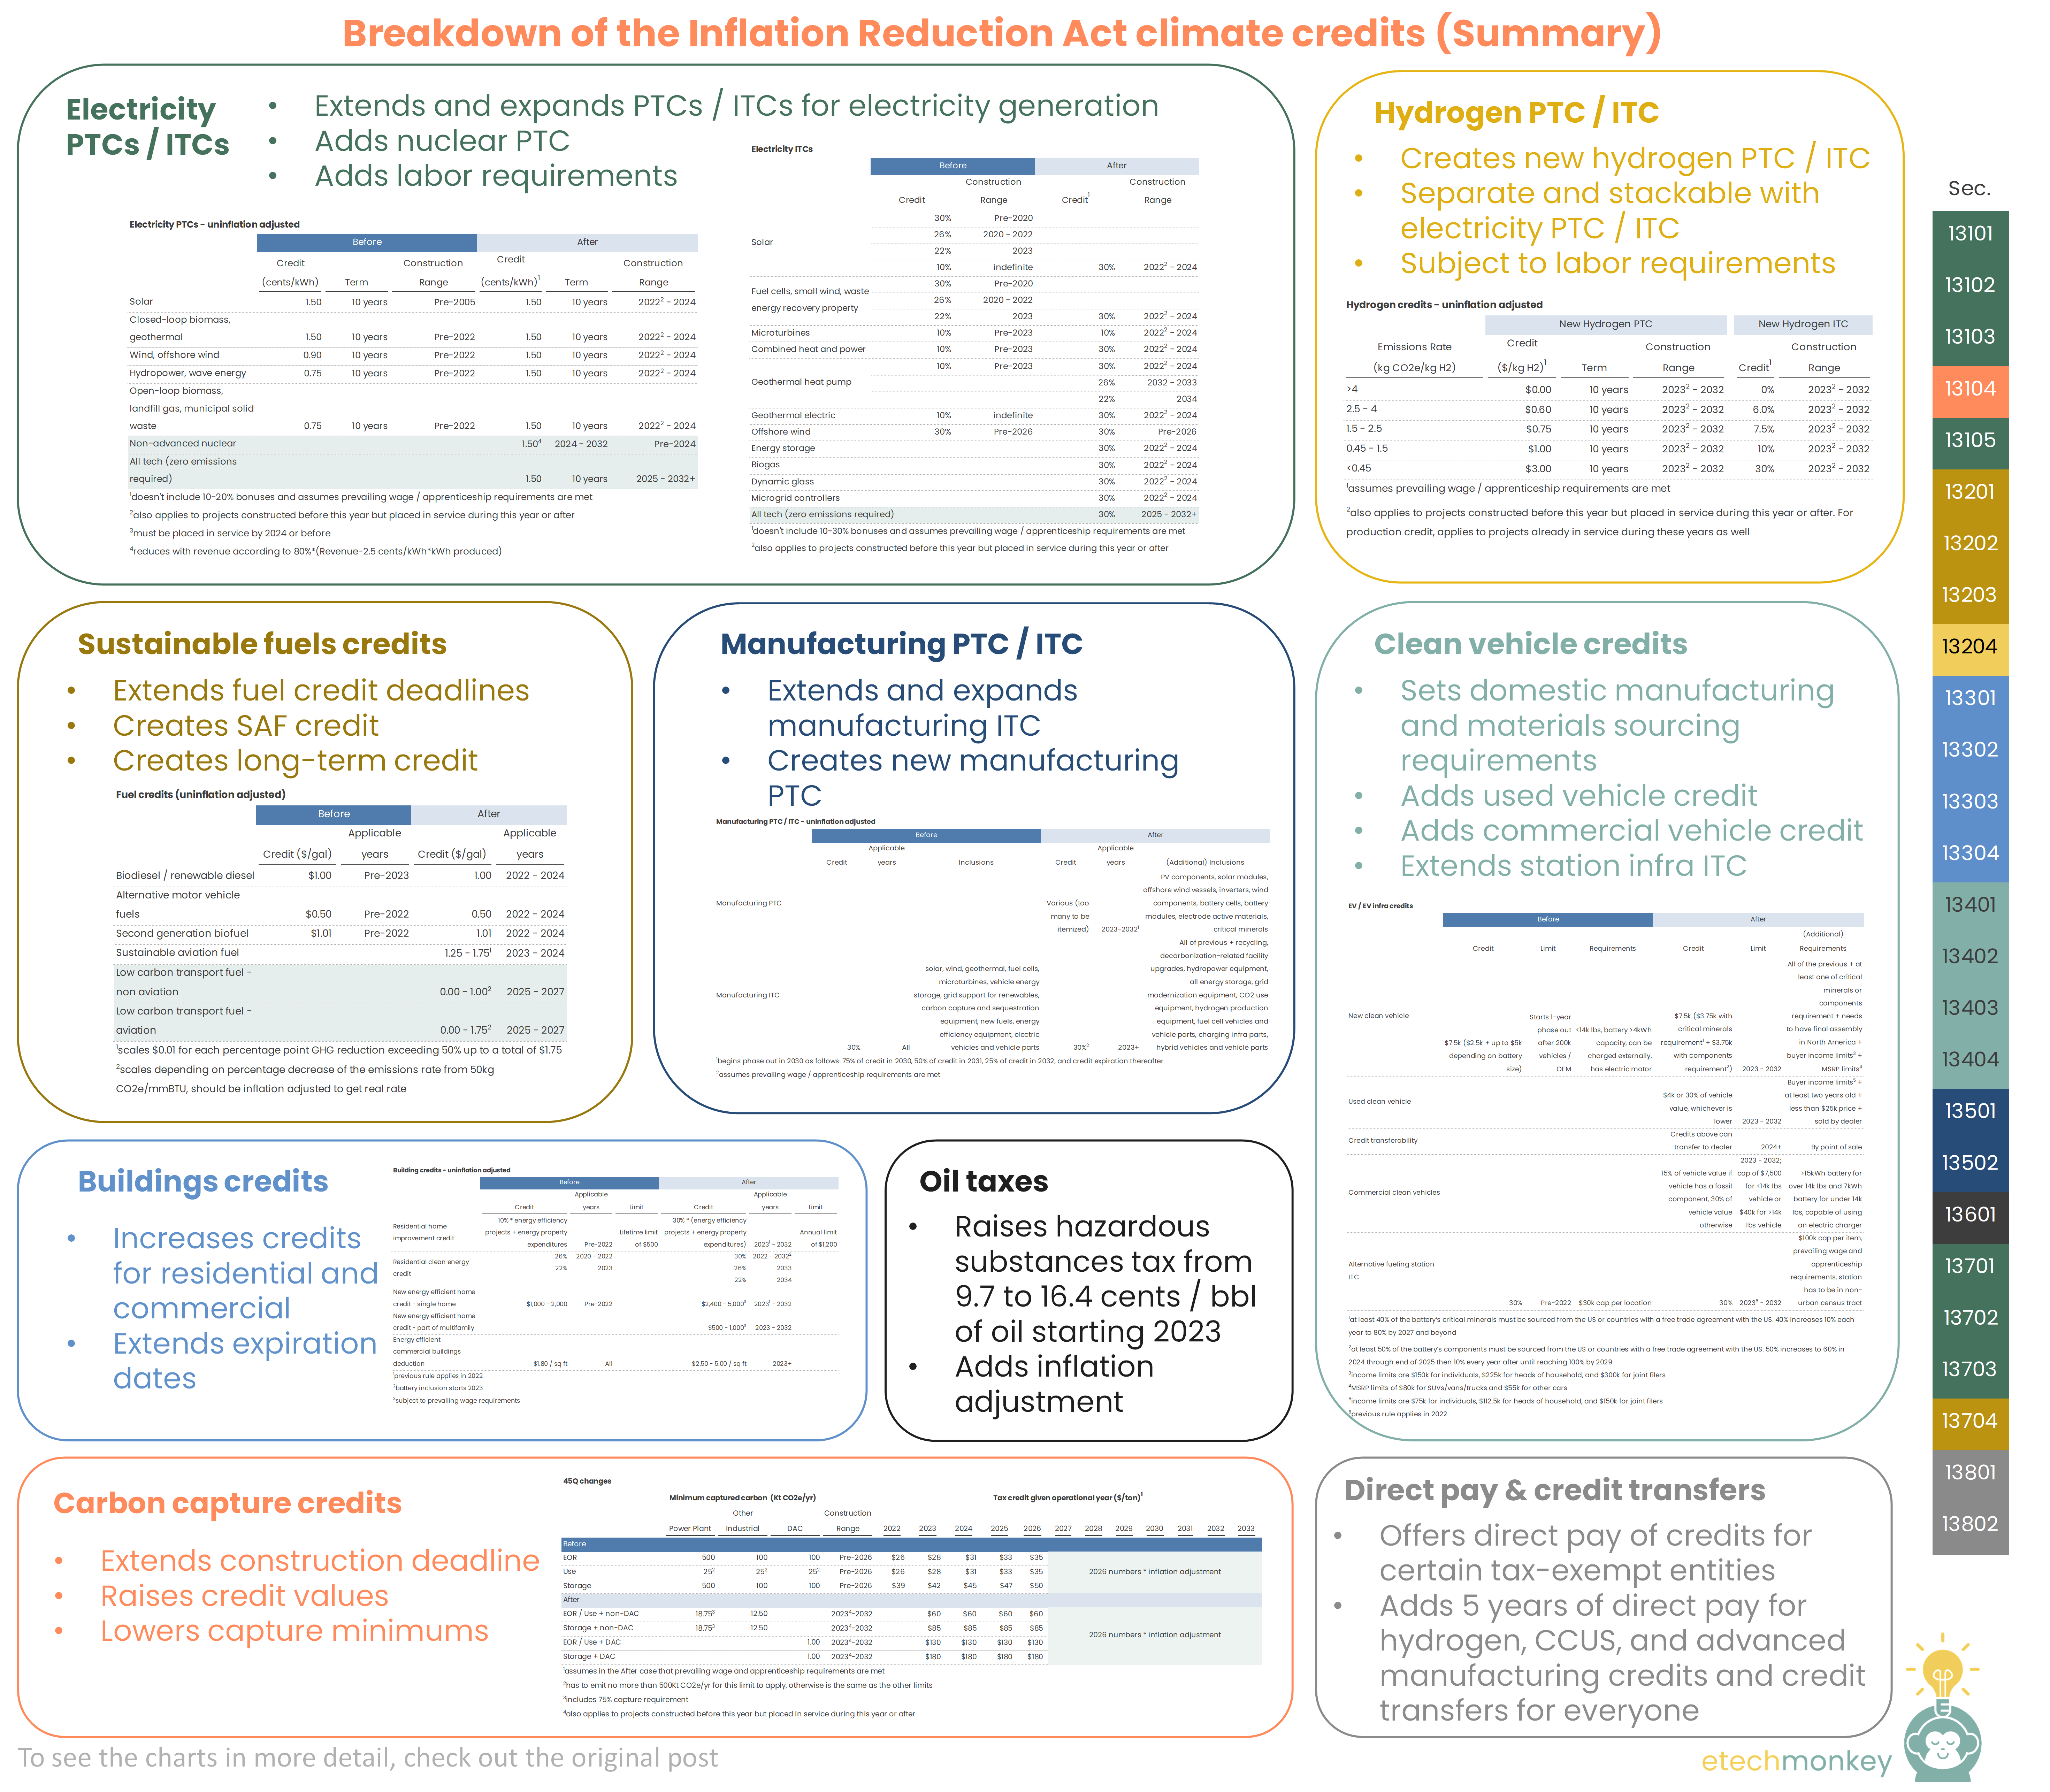
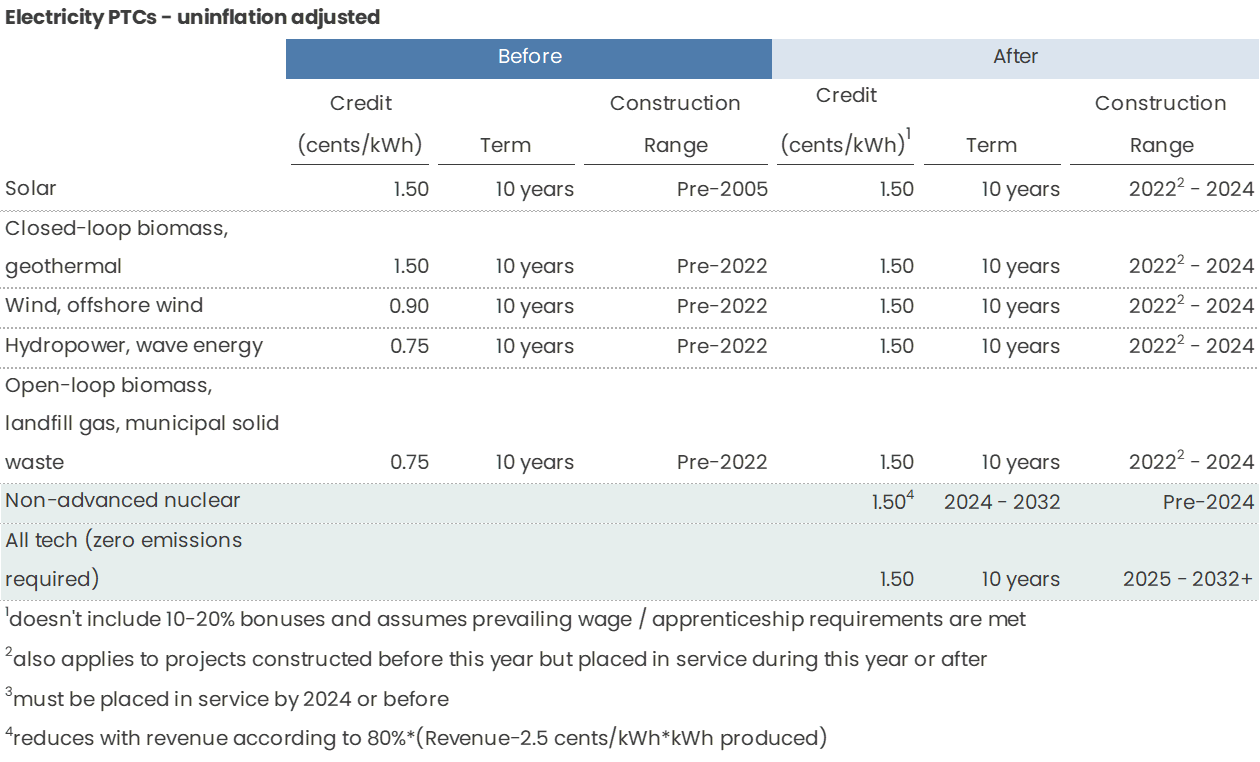
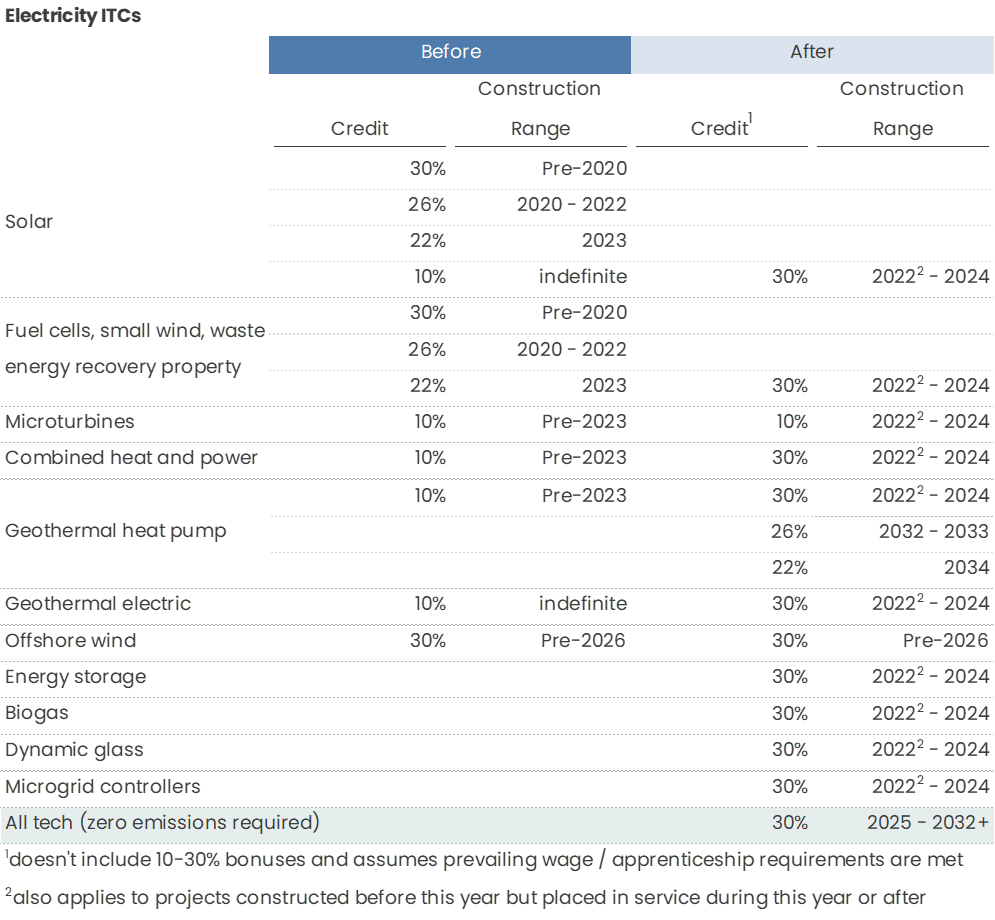
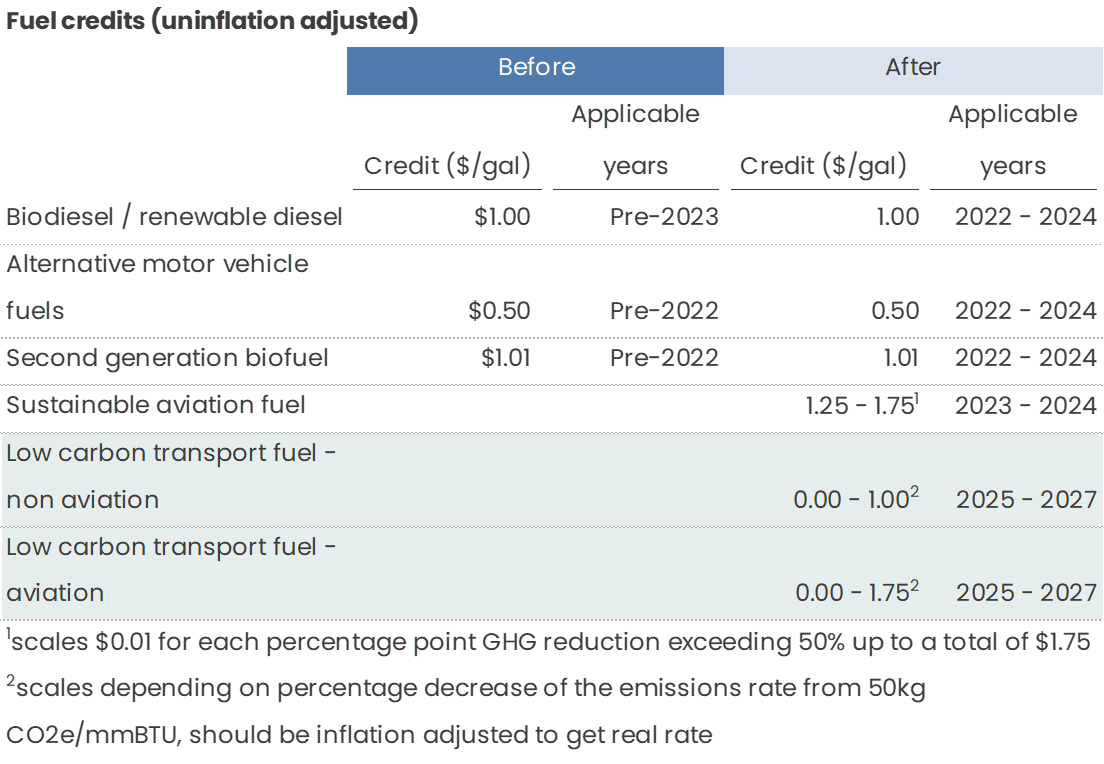
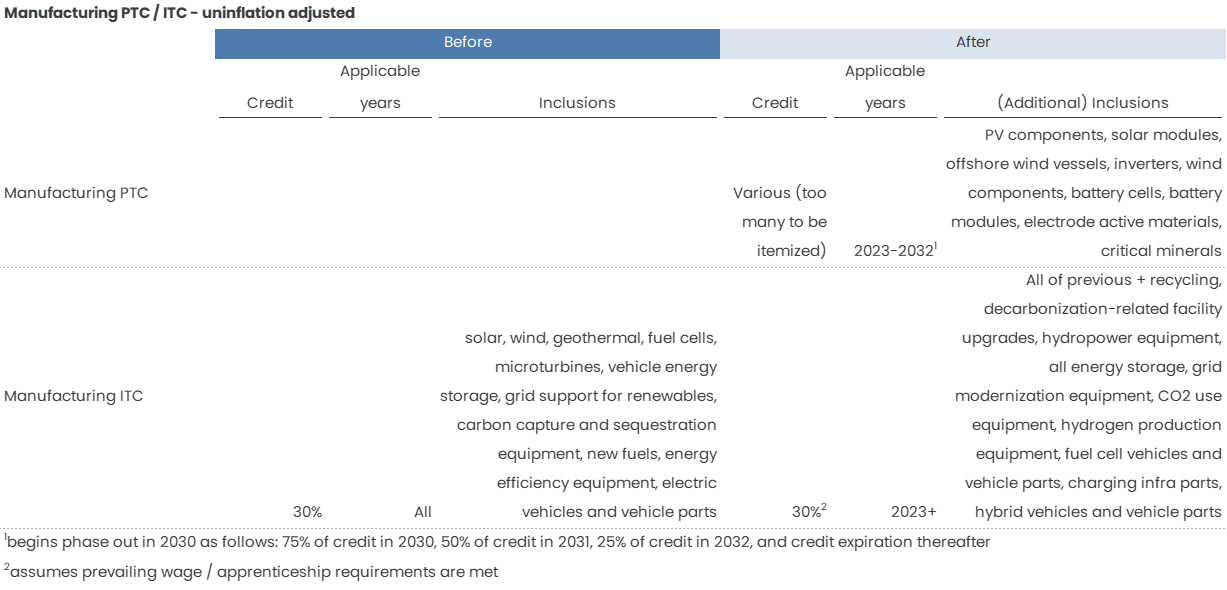
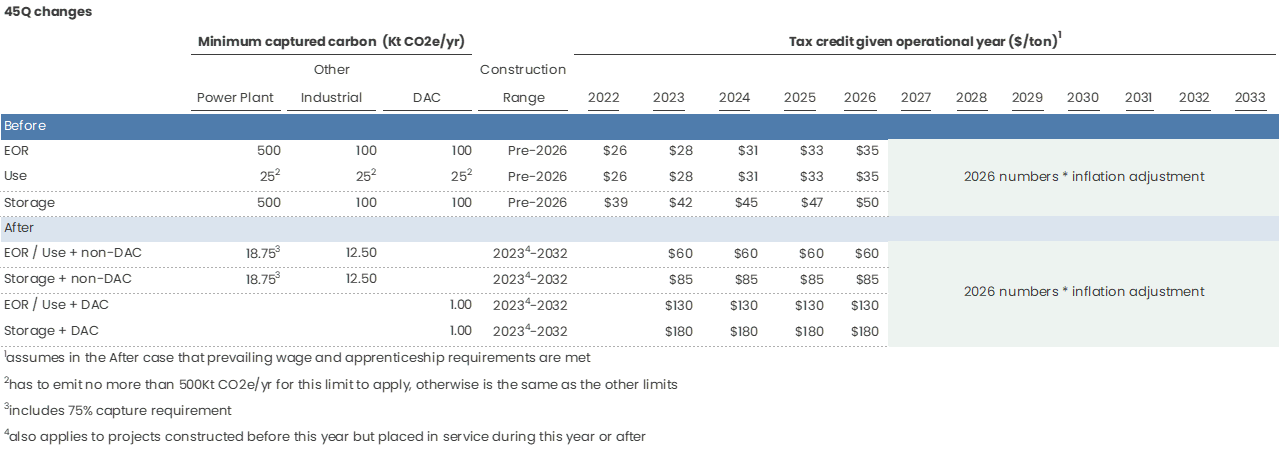
(Note 2: all of the following rates are NOT inflation adjusted like they should be to get the real rate.)


The full text: here
Other great summaries:
This week, following a similar vein to last week, will also be about personal carbon footprints. So if you’re sick of personal carbon footprints at this point, well, I’ve got a week or two more left on this subject! 😊
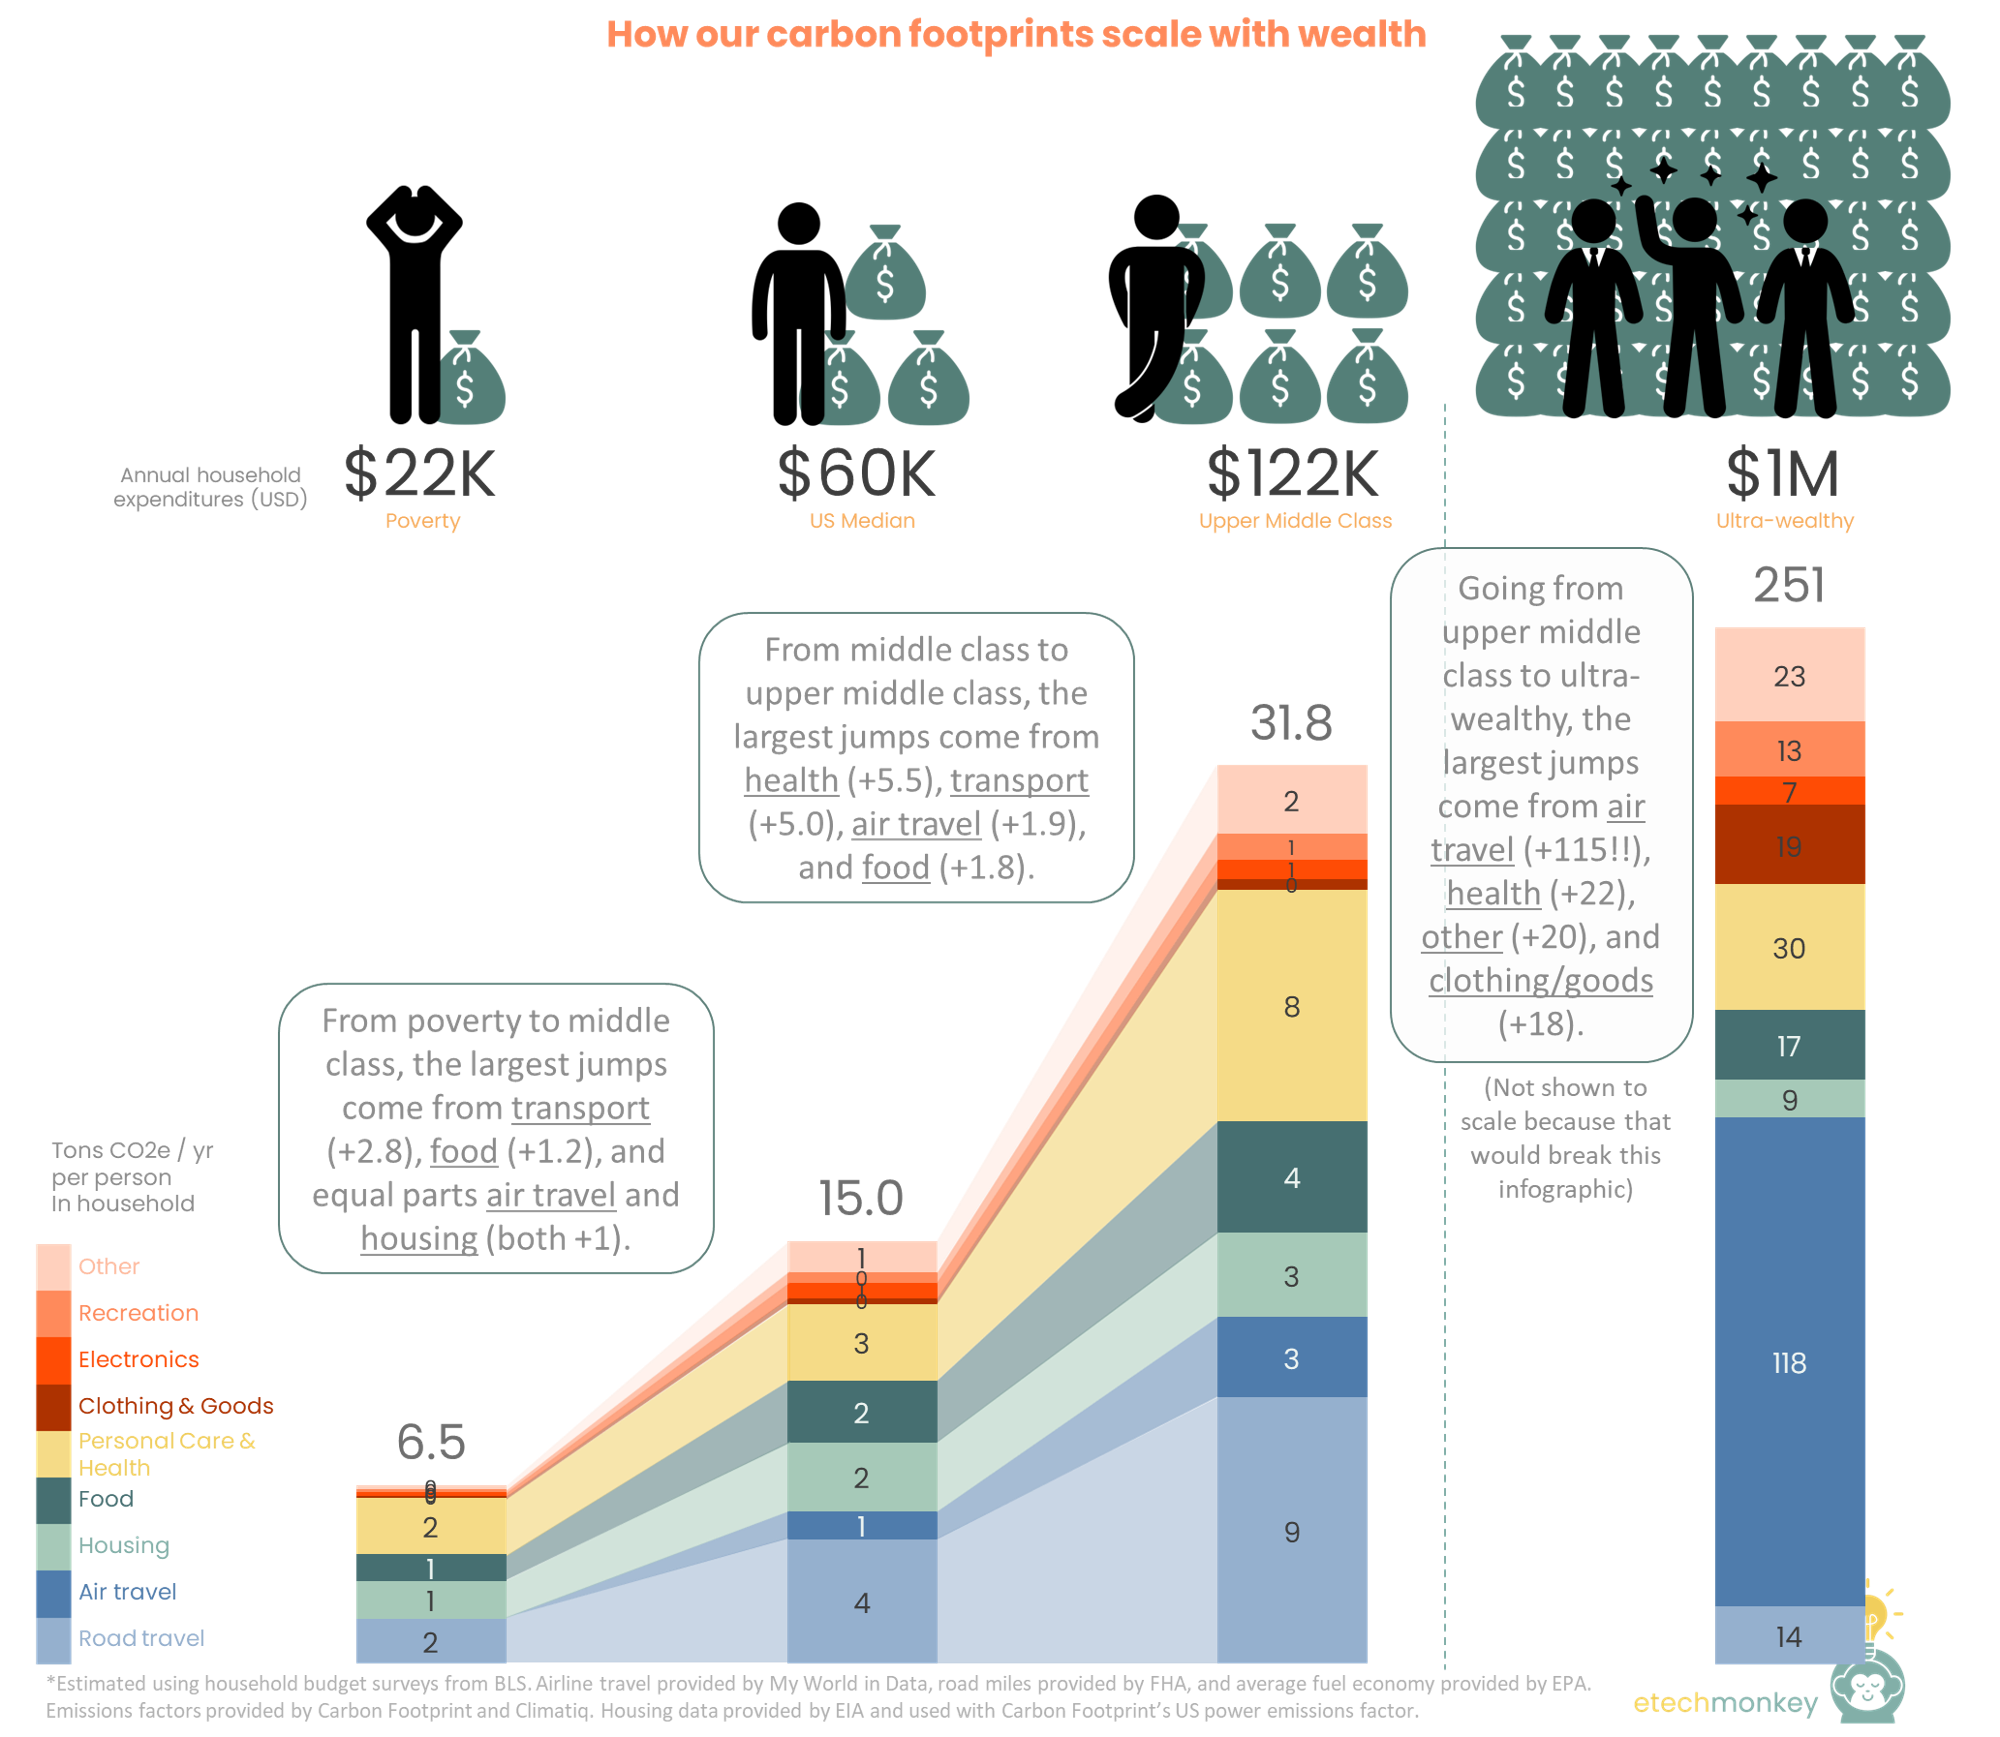
As I’ve mentioned before, people with higher incomes have a much larger impact on the environment. Rich people eat more, fly more, buy more…the list goes on. We saw this last time with the different incomes and corresponding footprints across countries.
But when you hold in-country infrastructure and emissions factors constant, how does wealth really scale personal footprint? Understanding this can help us figure out:
This might also provide some firmer benchmarks for me in understanding where I personally land on the carbon footprint spectrum compared to my income peers (which, by the way, has dramatically shifted since I quit my investment banking job…).
I looked at three income inflection points: 1) going from poverty to middle class, 2) going from middle class to upper middle class, and 3) going from upper middle class to ultra-wealthy. I assumed:
Note: Very similar calcs as last time were used in this analysis but done just for the US and using BLS-anchored income brackets. The full methodology is detailed at the end of this post.
Here are the results:
Observations:
Hope that was interesting and useful. I had fun with this one (especially combing through trashy articles to figure out how much celebrities spend).
Methodology
The footprint profile for each socioeconomic class was calculated at the household level (because most of the spending data available was household spending not individual spending) and the divided by 2.5 people, the average number of people in a US household.
The household footprint was split into three different sections:
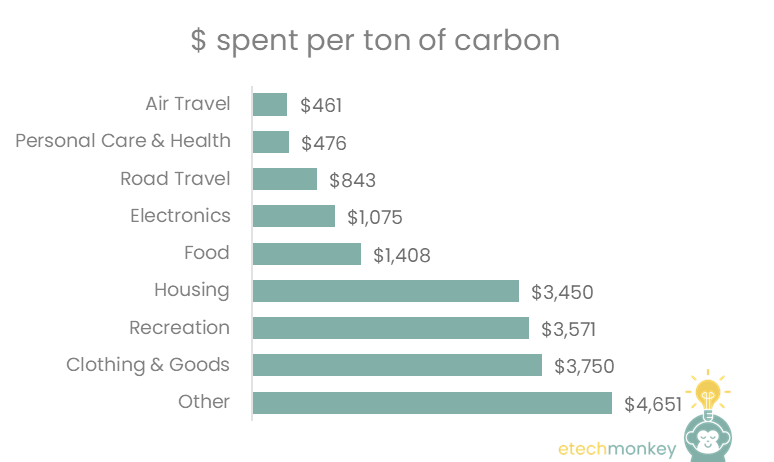
After looking into emissions across different regions and income levels for the family planning post and the consumer sustainability post, I was super curious to explore a detailed breakdown of these emissions numbers. How does the US have some of the highest emissions per capita at 14 tons, more than double – or even triple --- some of its developed nations counterparts like Sweden (3.8 tons), the UK (4.9 tons), or Japan (8.2 tons)?
I first suspected that some of this was due to the US’ high oil and gas production. And indeed, many of the countries with the highest emissions per capita are some of the world’s largest oil producers (Qatar, 37 tons, Saudi Arabia, 18 tons, Kuwait, 20 tons) but the correlation isn’t perfect. Norway, which lands in the top 5 for most oil production per capita, only produces 7 tons CO2 per capita. Russia (10 tons) also comes in below the US despite ranking higher in oil production per capita.
So lifestyles are playing a part in driving these emissions numbers. But to what degree? To test this, I wanted to see if I could replicate emissions per capita for several countries using average household budgets, miles traveled, and emissions factors.
I hoped to understand better:
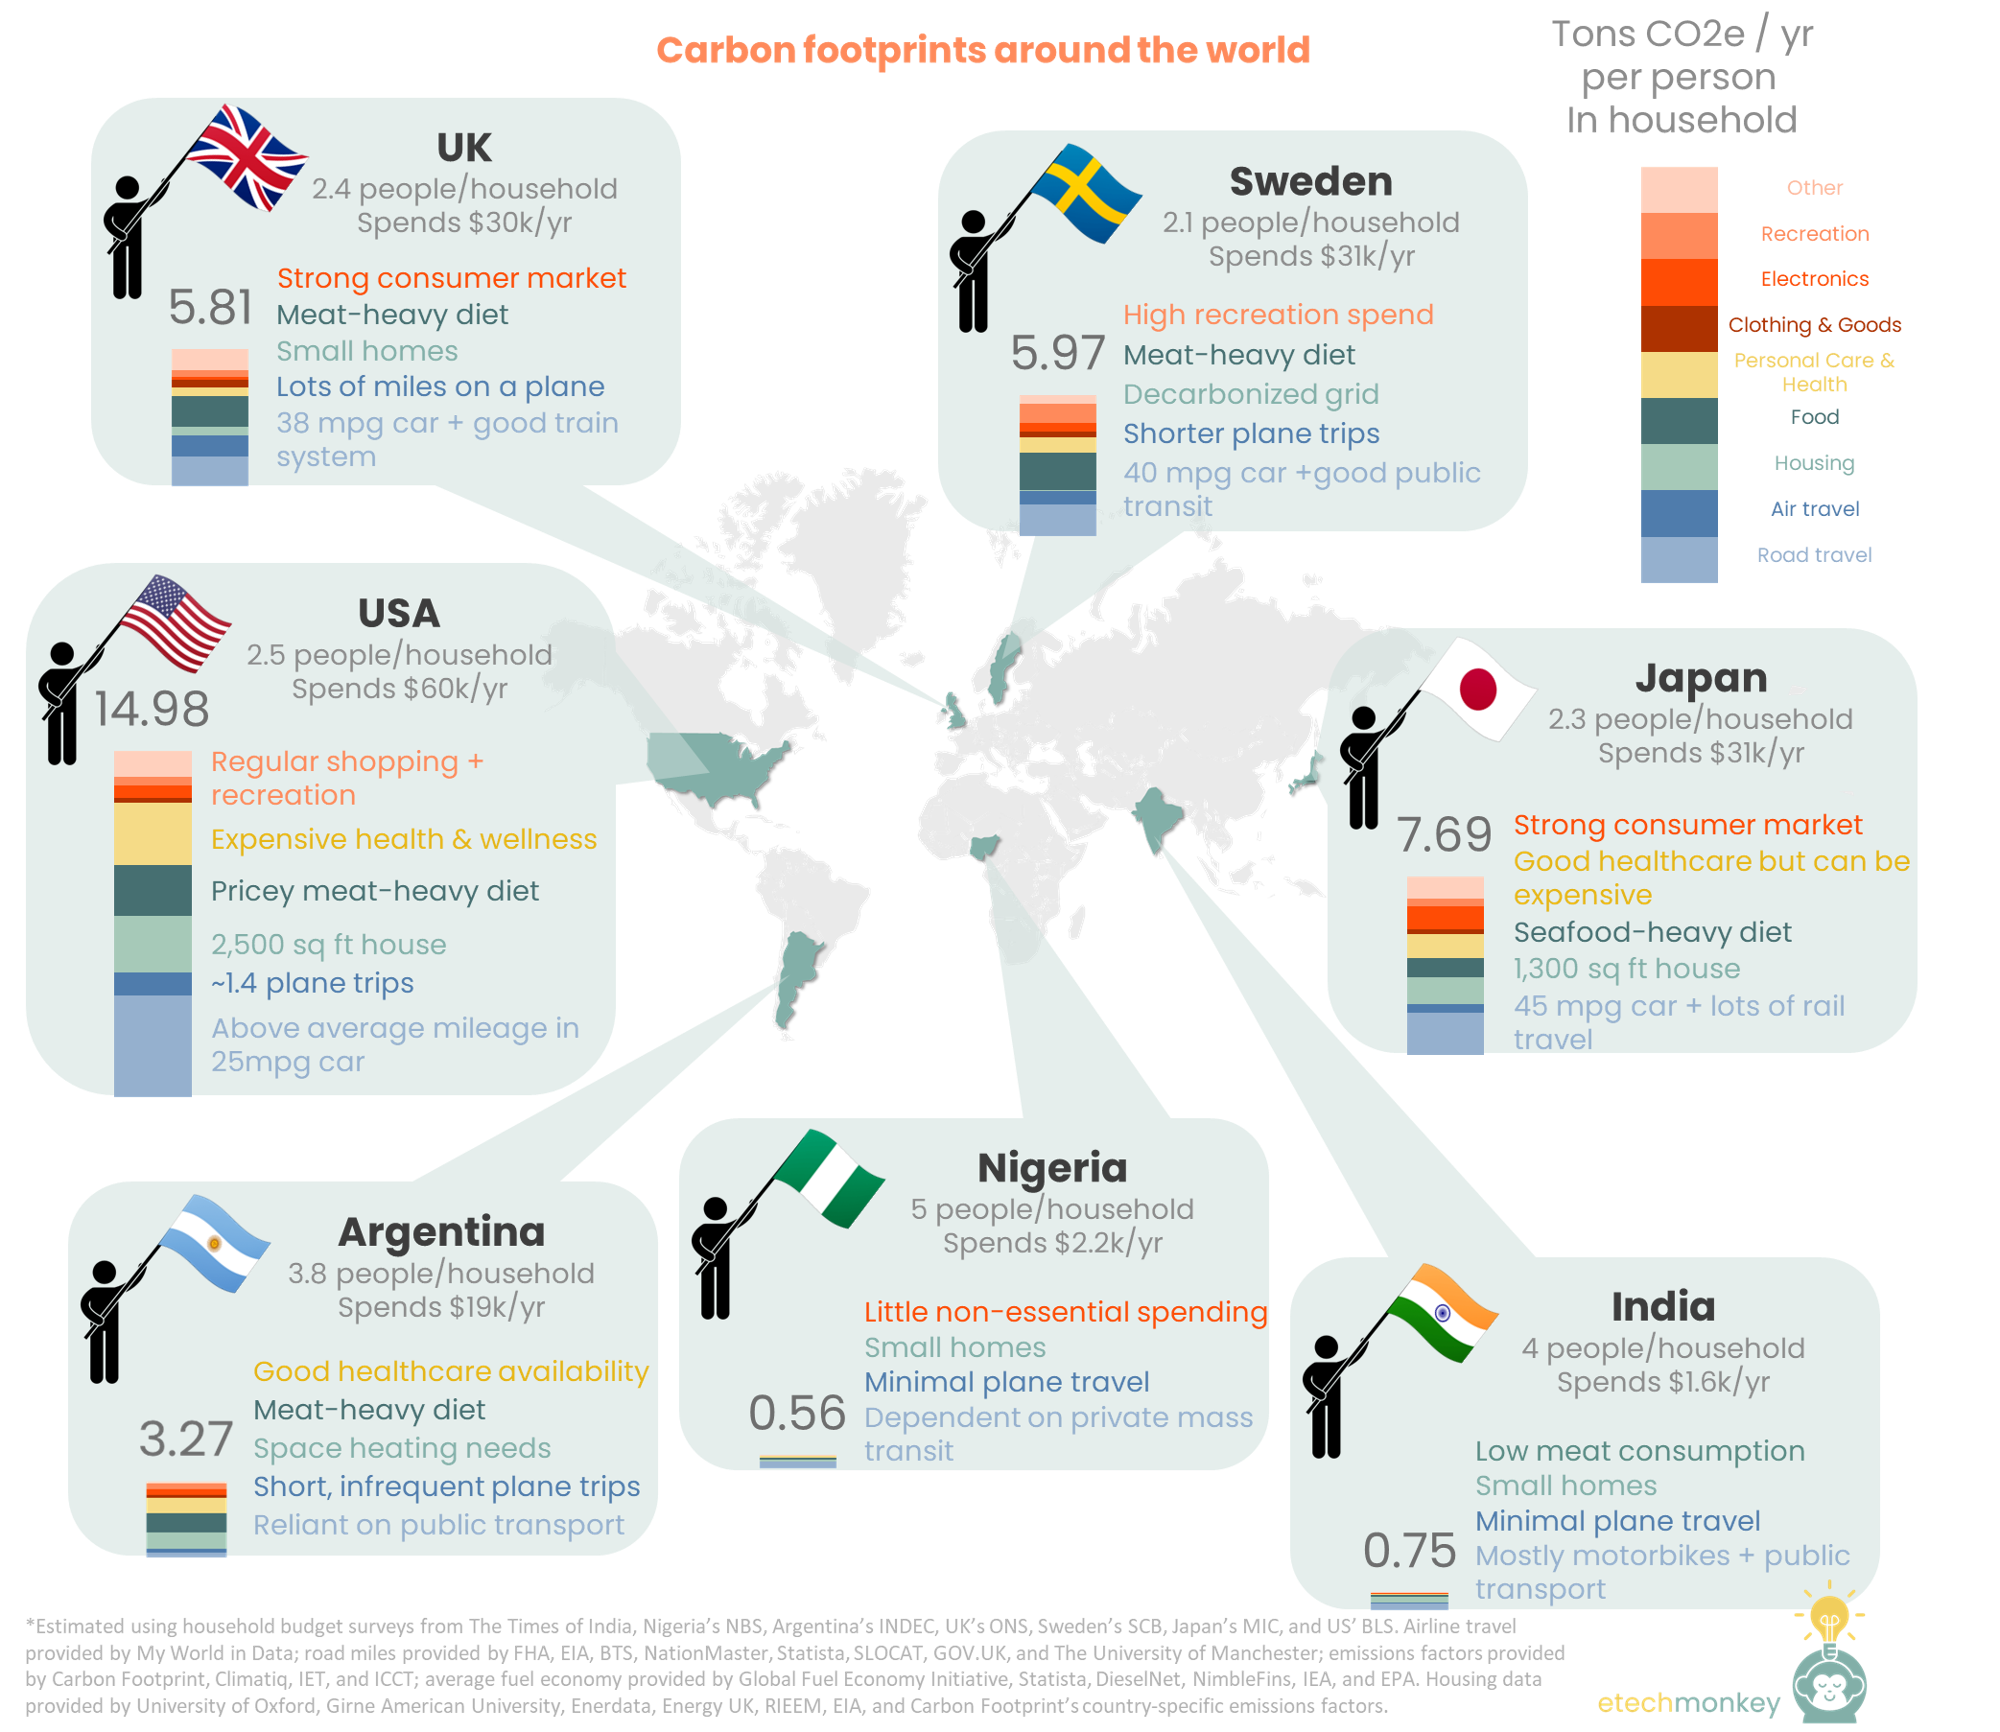
The 7 countries I studied were: US, UK, Sweden, India, Argentina, Nigeria, and Japan. This group had good availability of data, “different-enough” geographies and lifestyles, and a wide distribution of emissions per capita numbers.
Here are the results (and for those curious on methodology, that’s at the bottom of this post):
Observations & takeaways:
Methodology
The footprint profile for each country was calculated at the household level (because most of the spending data available was household spending not individual spending) and the divided by the average number of people in a household (as provided by each country’s census data).
The household footprint was split into three different sections:
I’ve always believed that for a carbon economy to be whole, consumers need to be part of the market. Consumers drive demand which can structurally shift supply chains towards cleaner, greener sources. By buying things at a green premium, consumers can make non-rational (in the economic sense) choices to push for sustainable products. This can incentive the industrial system that would, outside of what comes from investors, have little to no financial motive to transition.
Of course, the carbon economy can function just fine without consumers. Businesses produce carbon and buy offsets from other businesses and businesses can also pledge to be green for reasons other than consumer involvement (e.g. avoiding climate risk, investor pressure, or just plain wanting to do good). So it’s incorrect to say that consumer involvement is a necessity for energy transition.
But consumers do have power. The rapid proliferation of data, apps, social networking, and online marketplaces has given the consumer an unprecedented amount of optionality in almost every area of consumption. Food, cars, flights, electricity, gadgets…as a consumer, we’re armed to the teeth with choice. And with that choice comes leverage.
The other side of it is that consumerism has led to a substantial increase in emissions. The emissions gap between the wealthy and poor is well documented, with the richest 16% of the world having more than 7x per capita emissions as the poorest 50%. Even a wealthy microcosm like the US clearly shows this gap. Many of the same countries with the highest household final consumption expenditure (HFCE), a marker for consumer spending, appear at the top of the list for emissions per capita as well (most of the exceptions being those countries that are net exporters of industrial products, which ends up counting against them on the emissions front despite their low consumption).
If we can engage consumers in emissions monitoring and reduction, maybe we can redirect that consumerism to more sustainable sinks, which can have big impacts. If the US lowered its average per capita emissions to where Japan’s level is right now, we can reduce our emissions by 43%, or almost equivalent to Biden’s 2030 goal.
Anyway, I’ve justified this post enough! The point is that the consumer side of the carbon economy is worth engaging. It can be the dark horse in the race to net zero. There are already software tools in the market for the emerging “prosumer” – or the proactive consumer – to use in leading a more sustainable life. These software tools target four main functions, with the first three part of what I call the prosumer cycle.
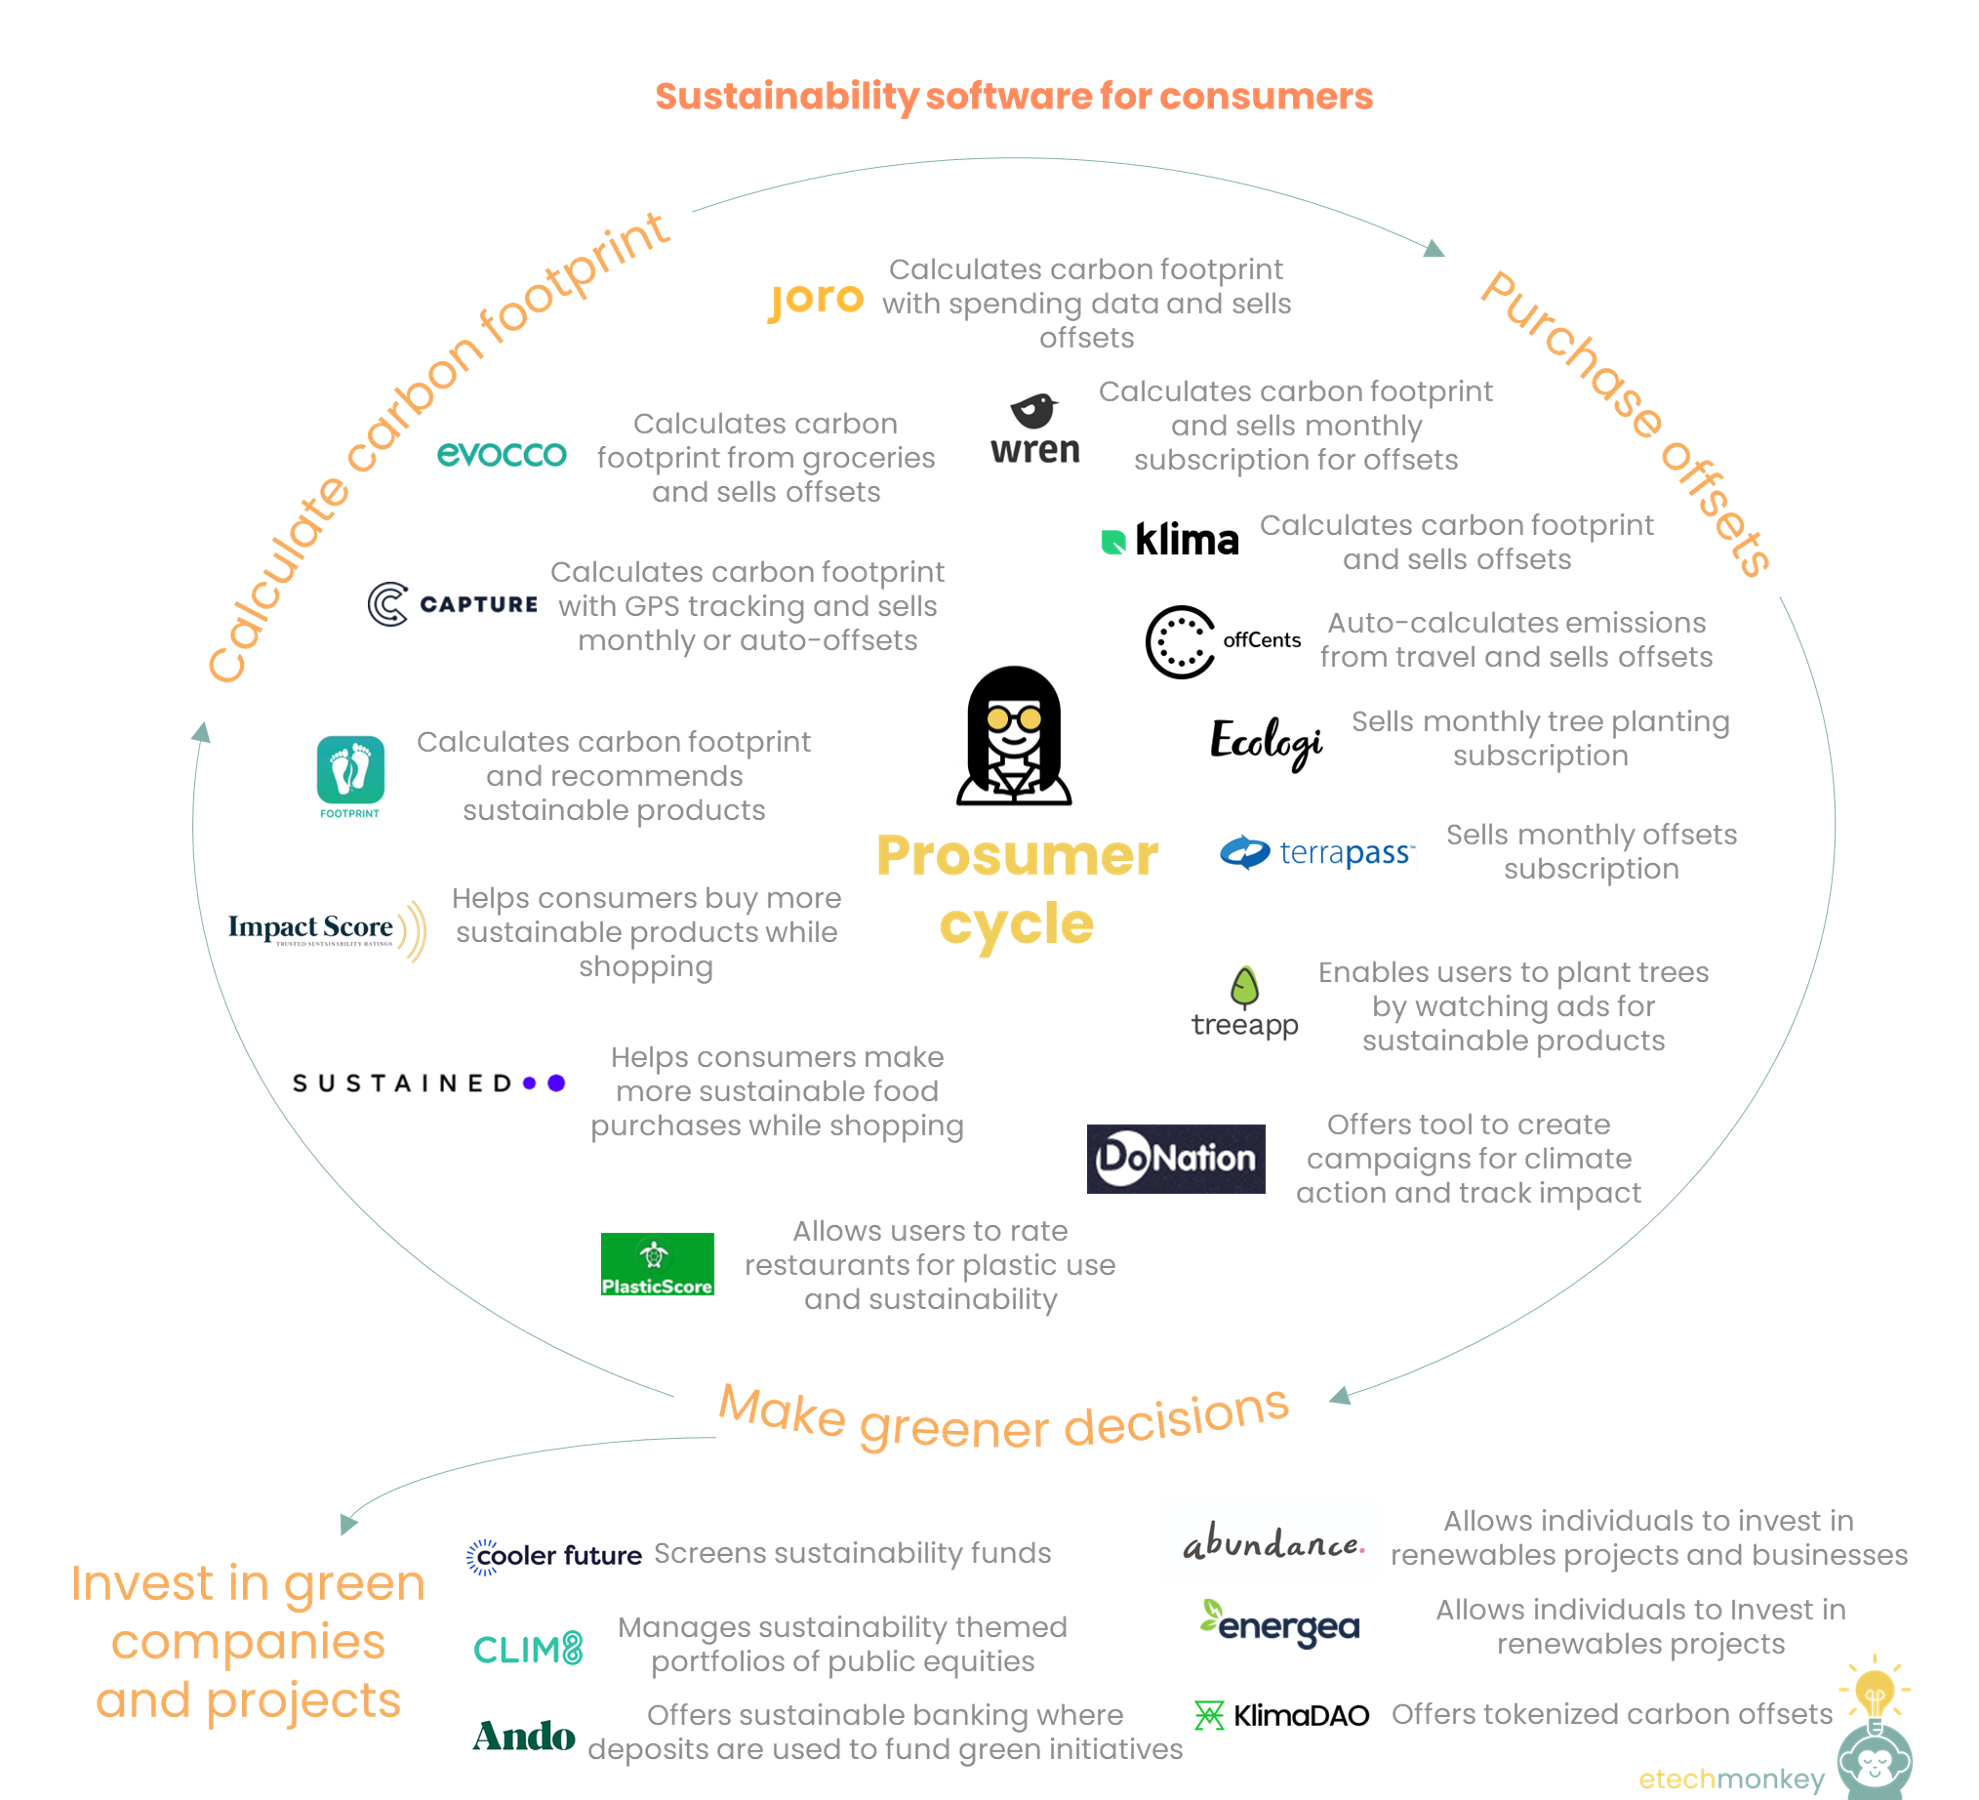
The prosumer cycle includes: 1) calculating your personal carbon footprint, 2) purchasing offsets, and 3) making greener decisions. The cycle goes like this -> the prosumer calculates her carbon footprint, buys offsets to “neutralize” that footprint, then proceeds to make greener decisions that feed back to the footprint calculation, which hopefully produces a lower number. Many companies in the prosumer cycle help the consumer with two or three parts of the cycle, most often combining calculating carbon footprint with either buying offsets or lifestyle recommendations. Some examples below:
Outside of the prosumer cycle is how the consumer can support the climatetech ecosystem through investing choices. Many different companies are working to bring the consumer into green companies and projects. Just a few of them here:
A big obstacle for these consumer apps is getting consumers to actually understand how to use these correctly. It’s not as natural to use a carbon footprinting app as it is a budgeting app or a social media app. I suspect that even the more popular apps on this list struggle to get the scale they need on the consumer-side…and I suspect that’s why many of these footprinting apps have developed enterprise products as well.
It'll be interesting to see what drives adoption of consumer sustainability software since there isn’t really “ESG pressure from stakeholders” for consumers as there is for companies…yet. The “stakeholders” for a consumer include friends/family, coworkers, and lenders (for car, house, etc). Will consumers be held accountable with an ESG score like they are with credit? Or will a peer-led movement drive adoption instead?
Something to ponder!
Last Thursday’s SCOTUS decision on West Virginia vs. EPA made waves across the climatetech community in denying the EPA’s authority to set power plant emissions targets using generation shifting and market mechanisms like cap-and-trade. It set a restrictive precedence on the EPA’s ability to accelerate energy transition and removes one of the key regulatory levers that the US has in its emission reduction battle.
I wanted to better understand what the impact of this ruling can be on absolute emissions numbers, power sector participants, and general ecosystem dynamics.
First, to provide some context on the case…West Virginia vs. EPA emerged from West Virginia (and other states) suing the EPA over the Clean Power Plan (CPP). The CPP was issued in 2015 by the Obama administration and was never actually put into action. It was replaced in 2017 by the Trump administration’s Affordable Clean Energy Rule (ACE), which eventually also died. So none of the policies being argued about in this case are actually active in any sort of way.
Nonetheless, the case resurfaced on the Supreme Court docket in October 2021 and SCOTUS decided to grant it for review.
The language under consideration is in Section 111(d) of the Clean Air Act (CAA), the main air quality law for the US and one that gives the EPA administration rights over emissions control. In Section 111(d), the EPA is granted authority to establish a “standard of performance” for emissions sources — aka an emissions limit — using “the degree of emission limitation achievable through the application of the best system of emission reduction.” In non-legalese, that means that the EPA can set emissions limits based on systems they believe an operator can achievably put in place to reduce emissions to that limit.
In the CPP, the “systems” they argue can span three “building blocks”: 1) internal facility improvements like making plants more efficient by upgrading equipment, 2) shifting generation from coal-fired units to natural gas-fired units, and 3) shifting generation from natural gas-fired units to renewable generation sources or nuclear. CPP also includes the option for states to establish a multi-state credits trading system in order to achieve those emissions goals.
The ultimate ruling of the court claimed that building blocks 2 and 3 + the potential cap-and-trade system were not clearly systems covered by “best system of emission reduction” in the CAA and that, because of the ambiguity and significance of future generation mix, the major questions doctrine applies. Under the major questions doctrine, the regulatory agency must be given clear authorization by Congress to decide on major issues. Since the EPA has not been given clear authority by Congress, it has no authority to put systems in place to shift generation sources.
My first reaction to this was that the case presents a troubling degree of triviality coupled with just straight misinformation. The court’s argument over the interpretation of “systems of emissions reduction” was anchored by its repeated statement that the EPA had never implemented similar system-wide mechanisms previously. For example:
But there is precedence for EPA establishing external mechanisms as “systems of emissions reduction.” The EPA has several existing emissions trading programs. The one it offered up in response to the court’s criticism is the 2005 Mercury Rule, which the court said was not applicable because “in that regulation, EPA set the emissions limit—the ‘cap’—based on the use of ‘technologies [that could be] installed and operational on a nationwide basis’ in the relevant timeframe.” The court continues to argue, “By contrast, and by design, there are no particular controls a coal plant operator can install and operate to attain the emissions limits established by the Clean Power Plan.”
This seems to be at best, misinformation, and at worst, misdirection. The CPP did incentivize operators to switch emissions sources, but the limits provided were very reasonable. For new coal plants, the limit of 1,400 lbs CO2 / MWh assumed an efficient steam unit with partial carbon capture. For existing coal plants, the CPP did mandate that some level of emissions reduction had to occur but acknowledged that the limits would depend on each individual units’ potential performance vs. the sweeping limit placed on new plants. That means that it was likely that for an existing coal-fired plant, the limit would have been much higher. And even if we do take the 1,400 lbs CO2 / MWh as the limit for existing plants, there is research indicating that equipment upgrades like CCS retrofits or ultra-supercritical steam generators can be cost competitive with generation shifting.
The emissions impact is minimal to modest. As said before, the CPP, or even its less restrictive ACE counterpart, was never put in place, so there is no direct policy impact from SCOTUS’ ruling.
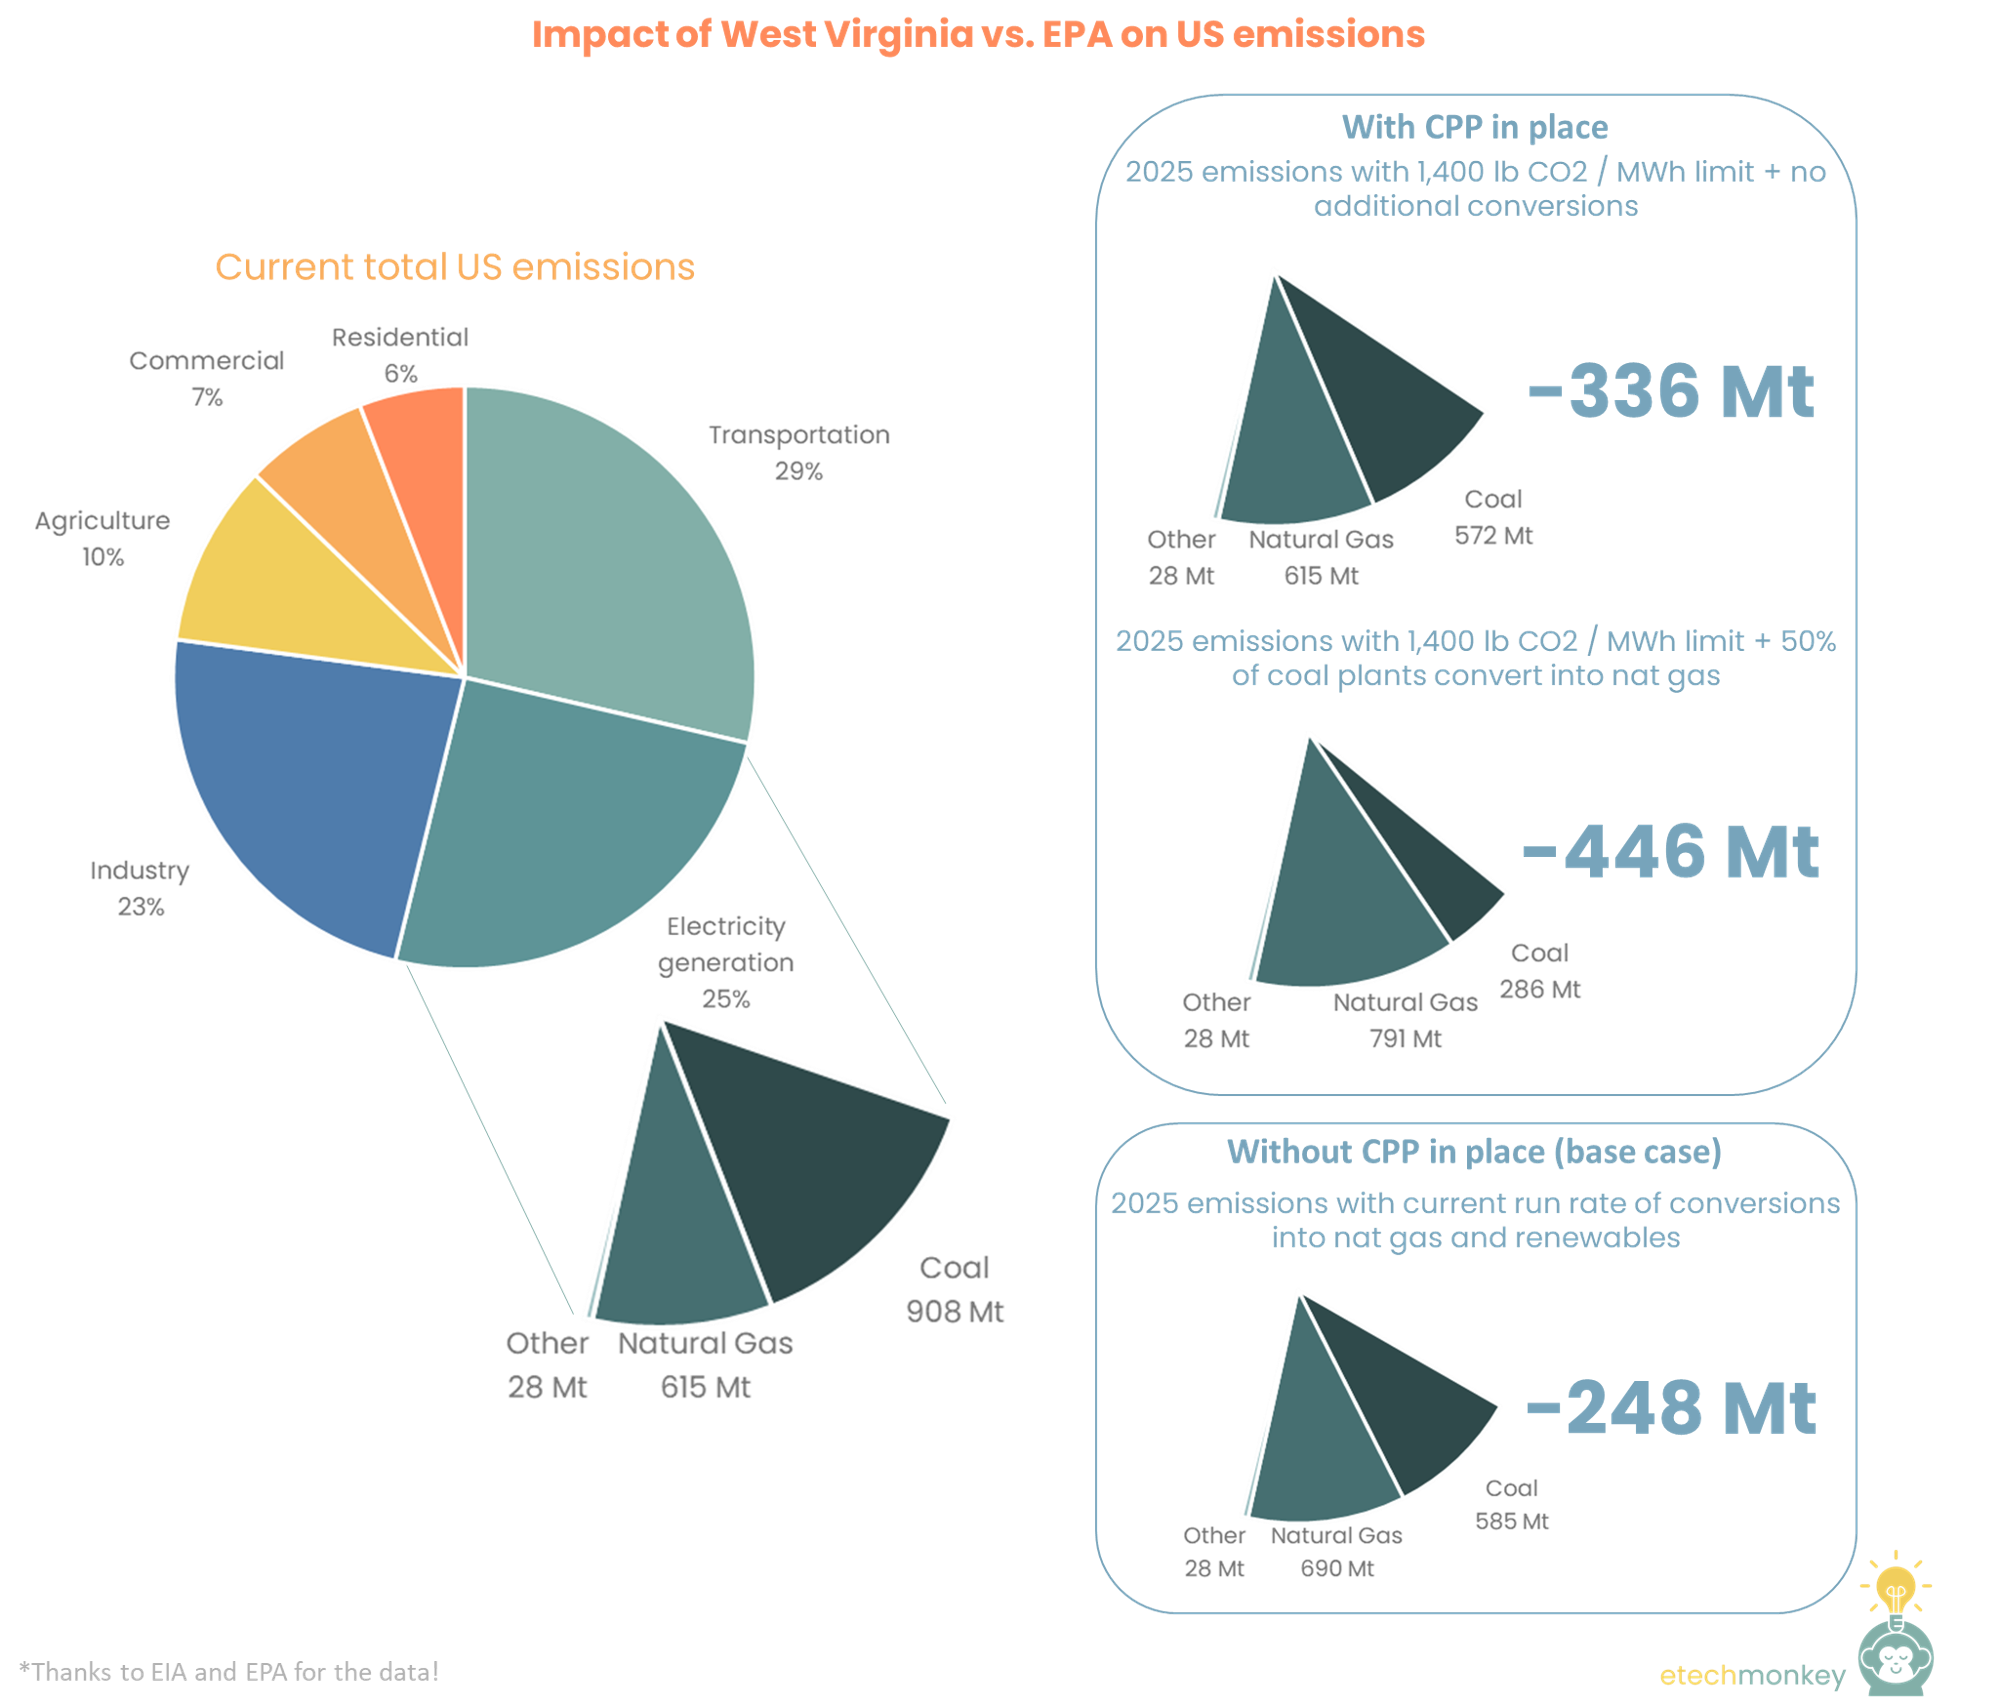
It’s also arguable what kind of impact CPP would have had in the first place. Despite not implementing CPP, the US has already reached the CPP’s 2030 target of reducing power sector emissions 32% from 2005 levels (32% of 2,411 Mt CO2 energy emissions in 2005 is 1,640 Mt…we’re at 1,551 Mt as of 2021). Nearly all of this can be attributed to coal retirements / conversions to NGCC and switching to renewables. Since 2007 (the peak in the last two decades), the US is down ~1,118 GWh of coal, offset by increases in nat gas, +679 GWh, and wind/solar, +459 GWh. Out of the corresponding 871 Mt CO2 decrease in power sector emissions, ~44% is due to using more nat gas and the remaining 56% from increase in renewables.
At the current rate of coal-to-nat gas and renewables switching (assumes linear rate of coal retirements and 60/40 switching to nat gas vs. switching to renewables), the US can get power emissions down 248 Mt by 2025 and 681 Mt by 2032, nearly completely switching from coal by the end of the decade. That’s a ~60% decrease from 2005 emissions levels, much more than the 52% that Biden recently announced as a goal for overall US emissions for 2030.
No doubt that the CPP, if implemented now, would accelerate a transition. If we assume that all existing coal plants have an emissions limit of 1,400 lbs CO2 / MWh (an aggressive assumption for the reasons outlined in the last section) vs. the current average of 2,223 lbs CO2 / MWh, emissions from coal would go down 336 Mt in 2021. Additionally, if, as a result of CPP, half of the coal plants in the US decide to switch to nat gas (which has an emissions intensity of 859 lbs CO2 / MWh) instead of retrofit, that impact number goes up to 446 Mt. It takes 3-5 years from announcement to completion for a coal conversion project, so we can take these numbers to be comparable to the 2025 emissions numbers mentioned in the previous base case. Even with a mass wave of retirements that an emissions limit would incentivize, CPP would only reduce 2025 emissions by another 198 Mt and accelerate the complete coal retirement timeline by perhaps 2-4 years.
Bottom line is that even without policy-driven generation switching, the shift is already happening, and adding policy can provide an incremental but modest boost to switching.
Others in the ecosystem will need to step up to the plate. Although there is already a healthy amount of generation switching, what this ruling does is take away EPA’s ability to set up an even more accelerated schedule of switching until Congress gives it explicit authority to do so. This will put pressure on Congress to be more active in putting out legislation that makes this authority clear or specifying the regulations themselves.
The increased difficulty of the EPA to create carbon pricing or additional cap-and-trade programs might also be problematic. Cap-and-trade in the US has had a tumultuous history, with several failed attempts in Congress over the years to establish a program. It’s unlikely if EPA is not given the authority that Congress will be able to pass such a measure in time for it to make a meaningful impact.
There are luckily other ways for the ecosystem to regulate itself. One less tool in the EPA toolbox means one more that needs to come from elsewhere. The three market participants I see that will have a larger responsibility as a result of West Virginia vs. EPA:
All in all, though West Virginia vs. EPA is pointed to as one of the most significant environmental rulings in many years, I feel hopeful that the actual impacts from the decision are minimal. Emissions in the power sector are already organically decreasing because of non-regulatory market forces. Active environmental leadership will still come from the companies that have already made it a priority. And we have a good number of non-regulatory levers that we can pull to incentivize industry-wide movement. Call me naïve but I have faith that structures we’ve built outside of regulation can continue to keep us afloat.